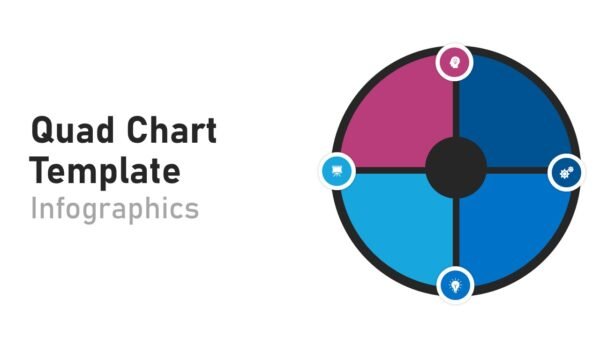
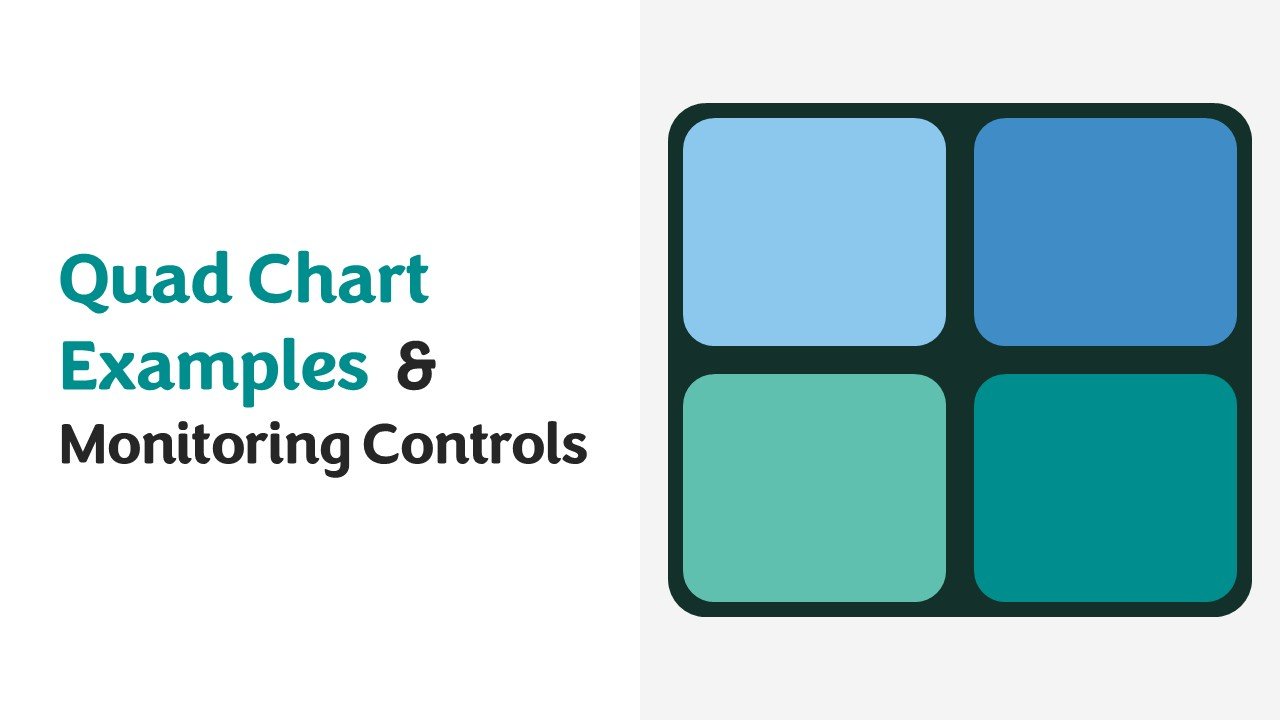
Quad Chart Examples and Monitoring Controls PowerPoint Infographics deck is designed for all consultants, project managers, executives, analysts and business trainers. This deck introduces some of the most widely-used or classic business frameworks (SWOT Analysis and the four P’s of Marketing, to name a few) as well as project management tools (BCG Matrix and Gantt Chart), matrix-based tools (Prioritization Matrix) and analytical tools (Project Health Indicator Dashboard).
As an analytics professional, you can use the premade shapes, icons, and edit the charts and text to create professional presentations that communicate your analysis and strategies.
Template Features:
-
- 10 Premium Infographic Slides: Includes examples of quad charts, matrices, dashboards and frameworks, strategies and analyses.
- Blue & Green Color Palette: Professional blue with green for analysis and reporting.
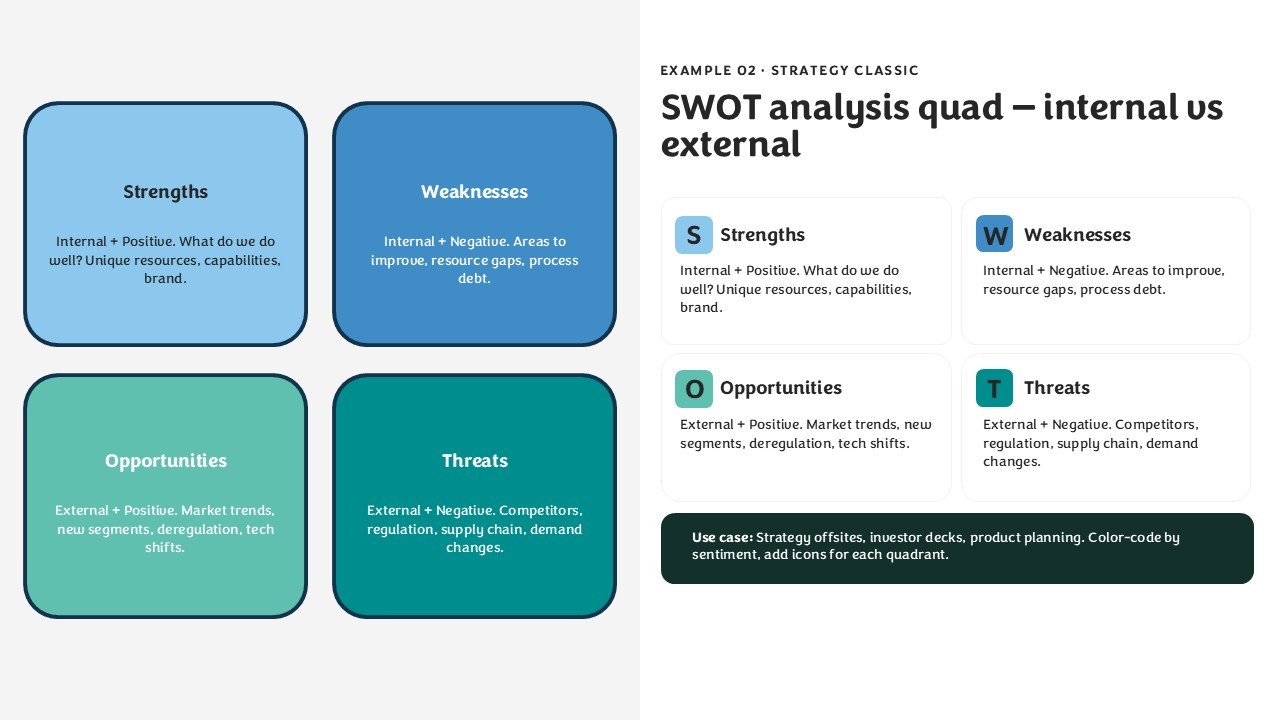
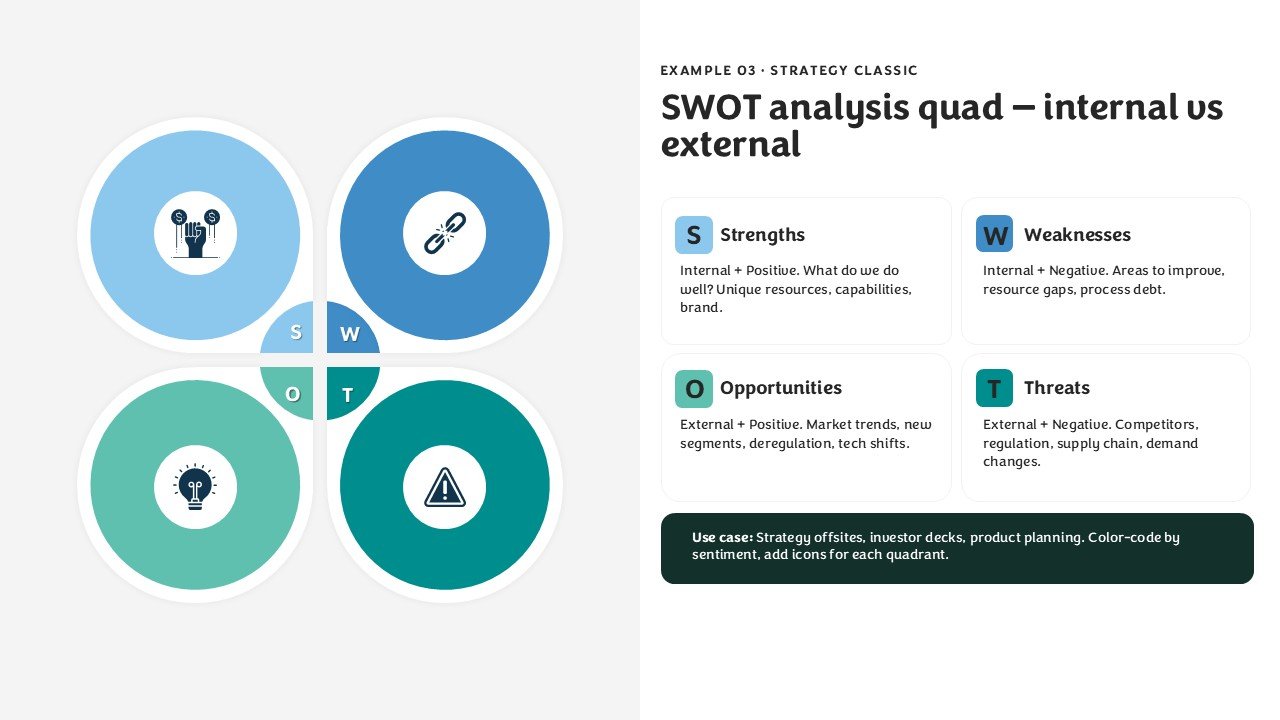
- SWOT Analysis: Evaluate each element in a separate quadrant.
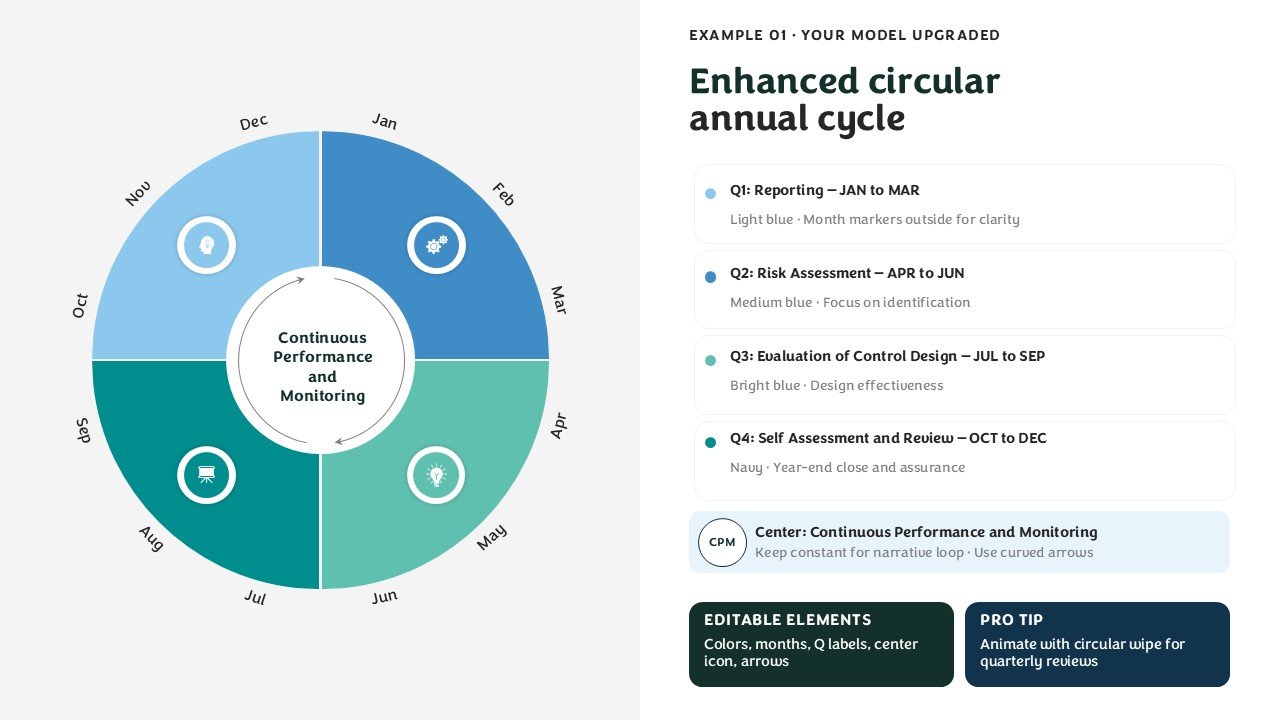
- Annual Cycle Matrix: Diagram a yearly planning cycle.
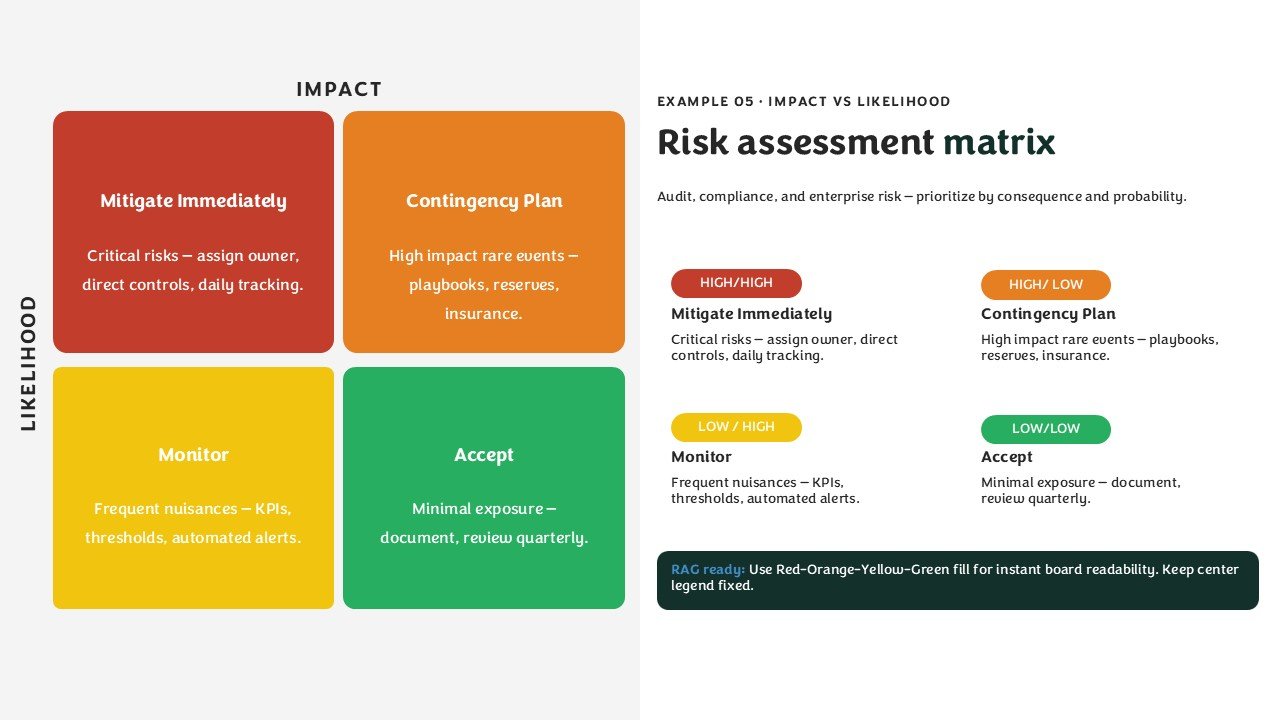
- Risk Assessment Matrix: Prioritize and track risks based on probability and impact.
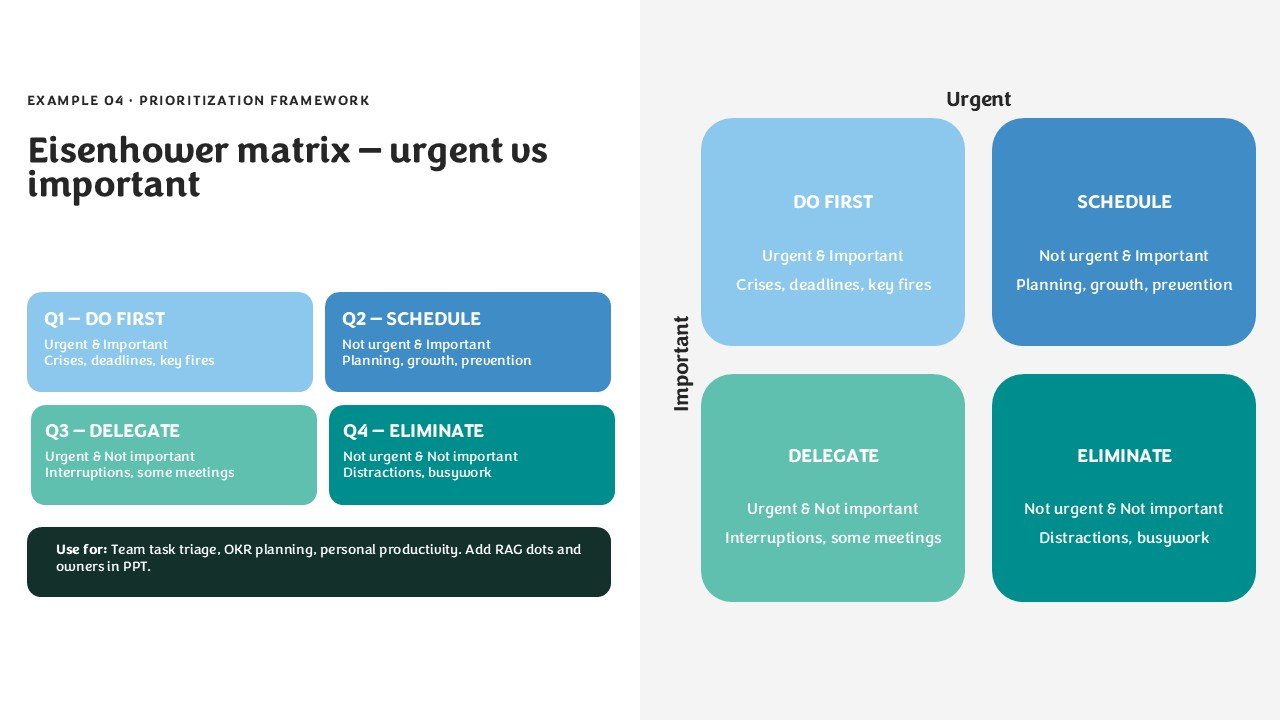
- Eisenhower Matrix: Prioritize tasks based on urgency and importnace.
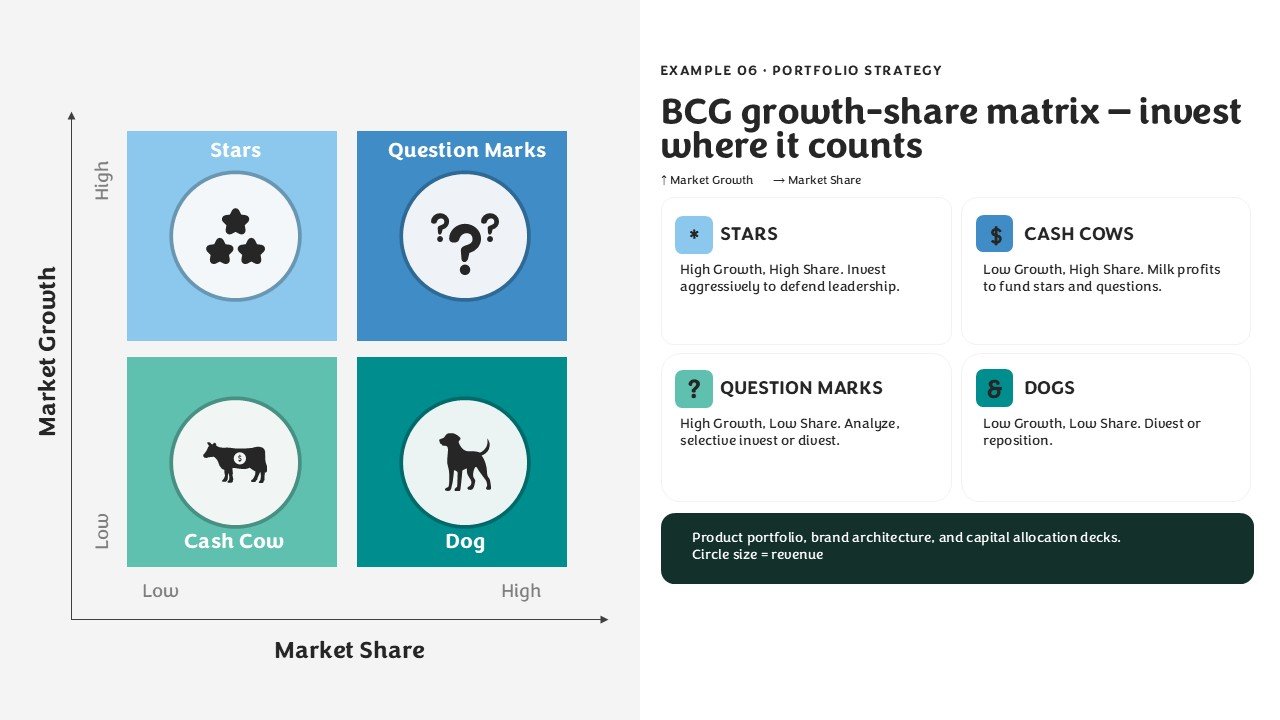
- BCG Matrix: Illustrate products and services based on market growth and market share.
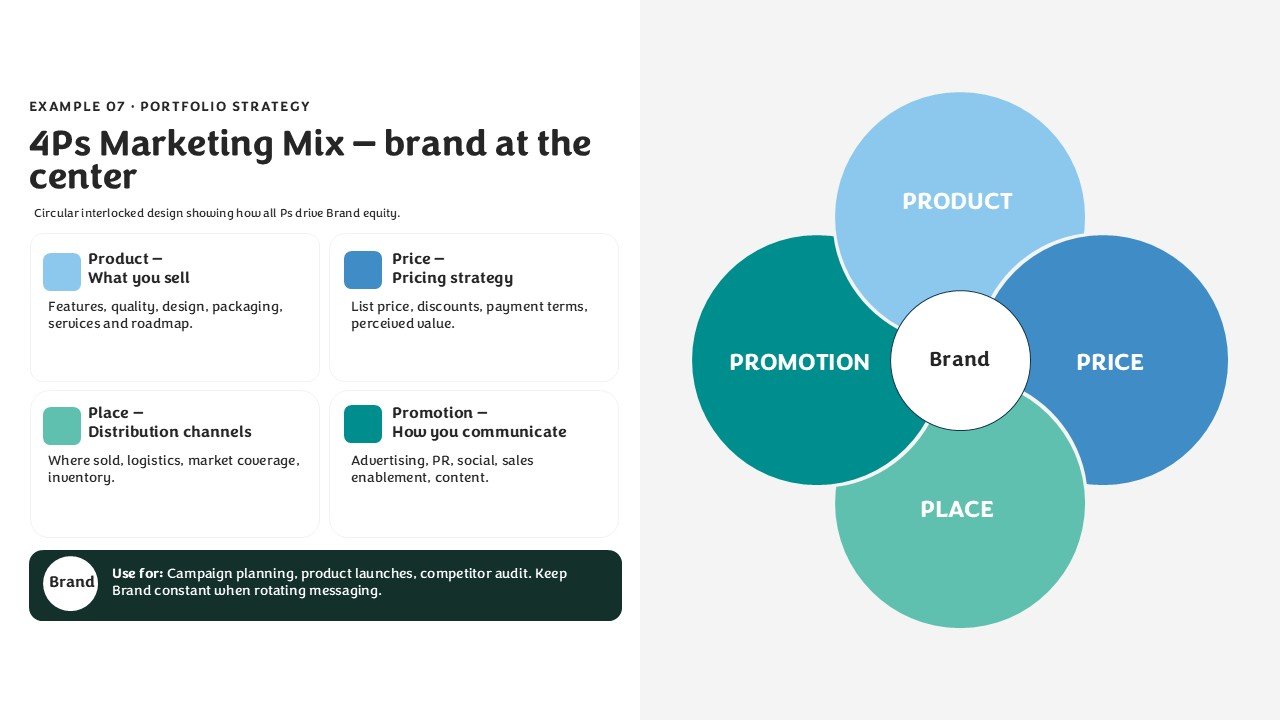
- 4P Matrix: Add a marketing element for each of the four= the Product, Price, Place, and Promotion.
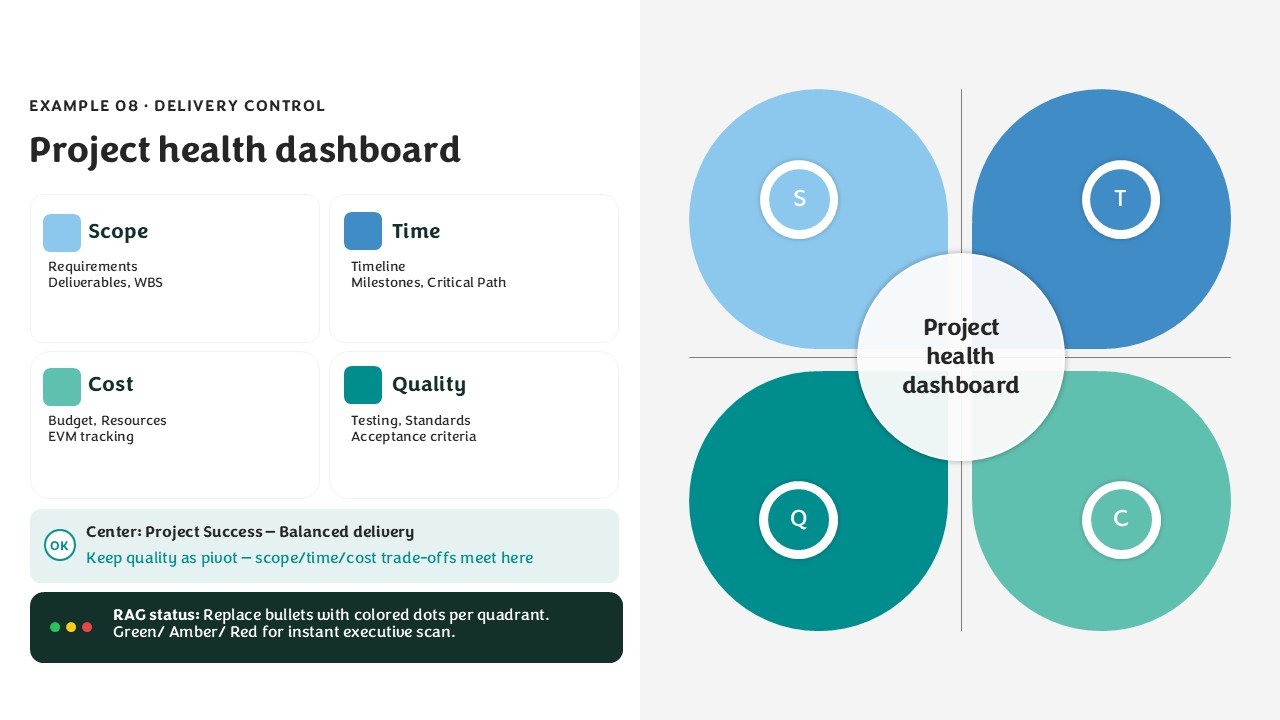
- Project Health Dashboard: Track the status of your project via schedule, budget, scope, resources, and health.
- 100% Fully Editable: Easily change the text, colors, icons, shapes, and diagrams directly in PowerPoint.
- 16:9 Widescreen Format: Ready to go for board rooms, project reviews, strategy meetings, consultative presentations, and workshops.
Perfect For:
-
- Business Consultants: Creating strategy presentations, consultative workshops, analytical reports, and business assessment frameworks.
- Project Managers: Monitoring project health, identifying risks, scheduling tasks, and updating stakeholders on project status.
- Marketing Professionals: Illustrating the 4Ps Marketing Mix, market positioning, product portfolios, and strategic priorities.
- Business Strategists: Communicating business strategies with BCG, SWOT, matrices, and other risk and strategy frameworks.
- Executives & Management Teams: Simplifying complex information with readable dashboards and strategic communication frameworks.
- Risk & Compliance Teams: Mapping risks, monitoring controls, assessing impacts, and communicating the priorities of your risk mitigation.
- Educators & Trainers: Teaching business concepts and strategies, prioritization frameworks, project management, and strategic analysis
FAQ’s
Is this Quad Chart infographic template fully editable?
Yes. All 10 slides are fully editable in PowerPoint. You can customize the text, colors, icons, shapes, diagrams, labels, and infographic elements.
What quad chart examples are included?
The presentation includes illustrations for SWOT, Annual Cycle, Risk Assessment, and the Eisenhower Matrix, along with other ready-to-go quadrant and monitoring templates for the Project Health Dashboard, BCG Growth-Share Matrix, 4Ps Marketing Mix, and other components.
Can I customize the Blue and Green color palette?
Absolutely. Each color can be individually edited and adjusted, meaning you can replace the blue and green with your brand colors or colors of your preference.
Can these layouts be used for monitoring and reporting?
Yes. The template is particularly useful for project monitoring, risk assessment, KPI reporting, strategic reviews, portfolio analysis, task prioritization, and management dashboards.
Can I use the BCG Growth-Share Matrix for my own products?
Yes. You can edit the matrix to display your own business units, products, or portfolio. You can also adjust this matrix to address your growth and market share analysis.
Is the Eisenhower Matrix editable?
Yes. Each of the four quadrants in this matrix can be used to adjust and modify prioritization of tasks and other matrices based on the importance of each item as well as the timing, and other factors.
Can I use the Project Health Dashboard for project reviews?
Yes. The dashboard layout can be customized with your own project indicators, status levels, milestones, risks, budget information, schedule information, and other monitoring metrics.


 MS Powerpoint
 Google Slides