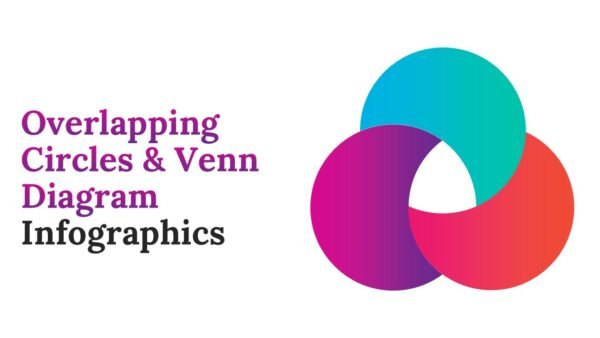
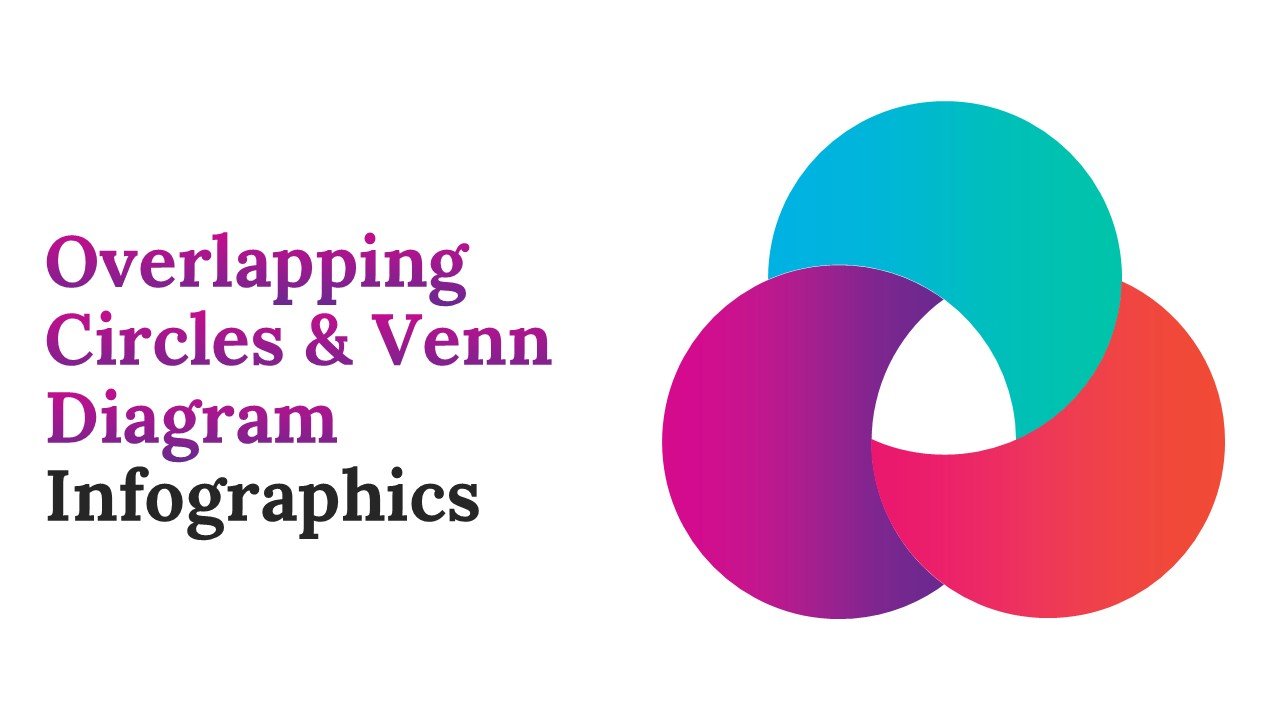
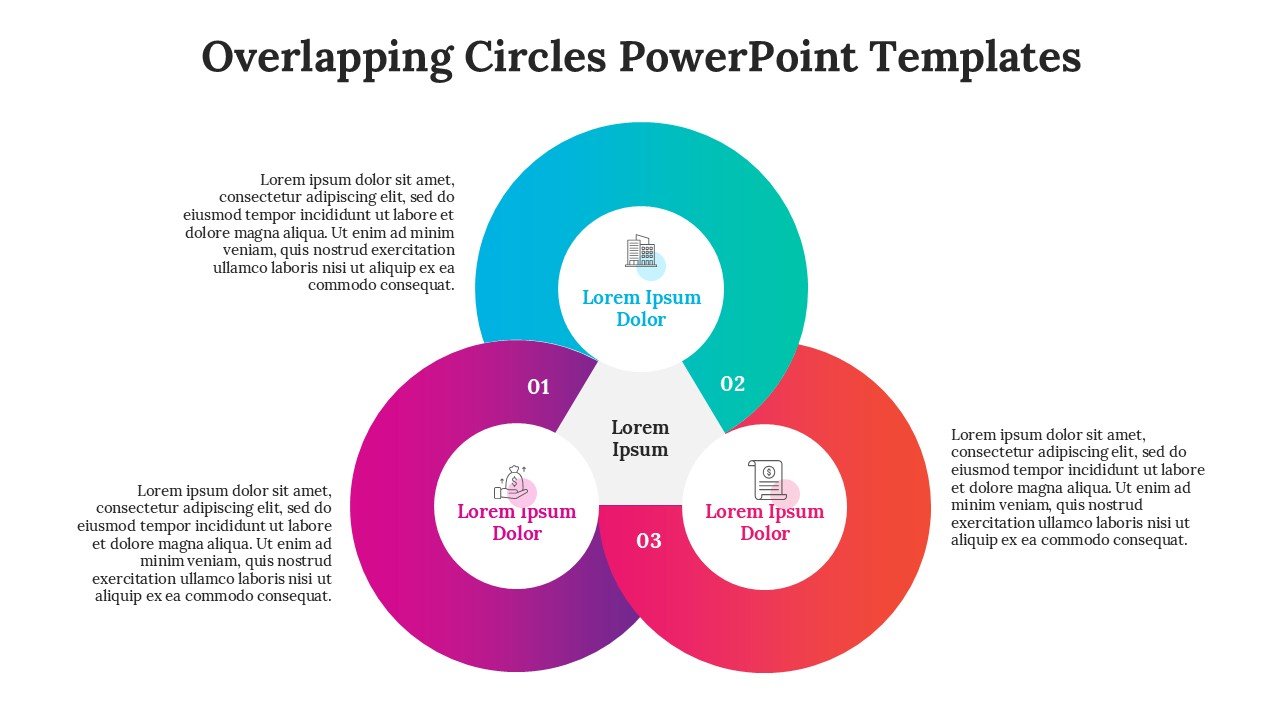
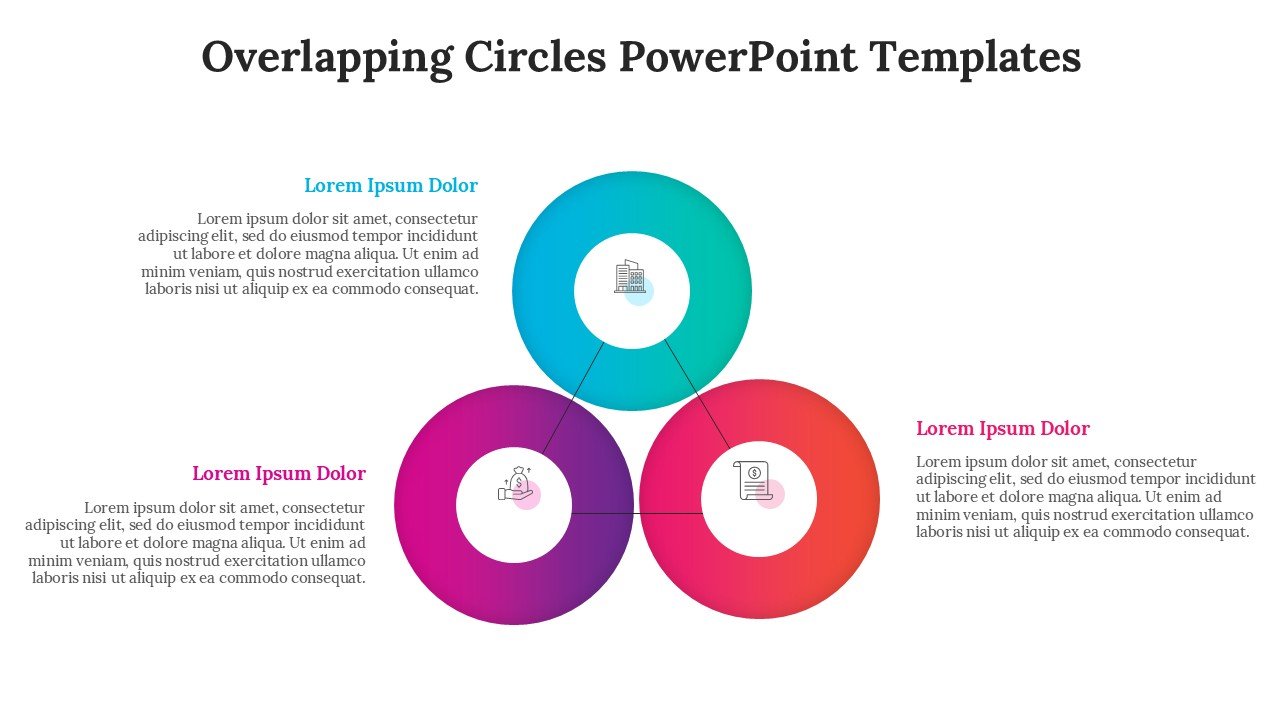
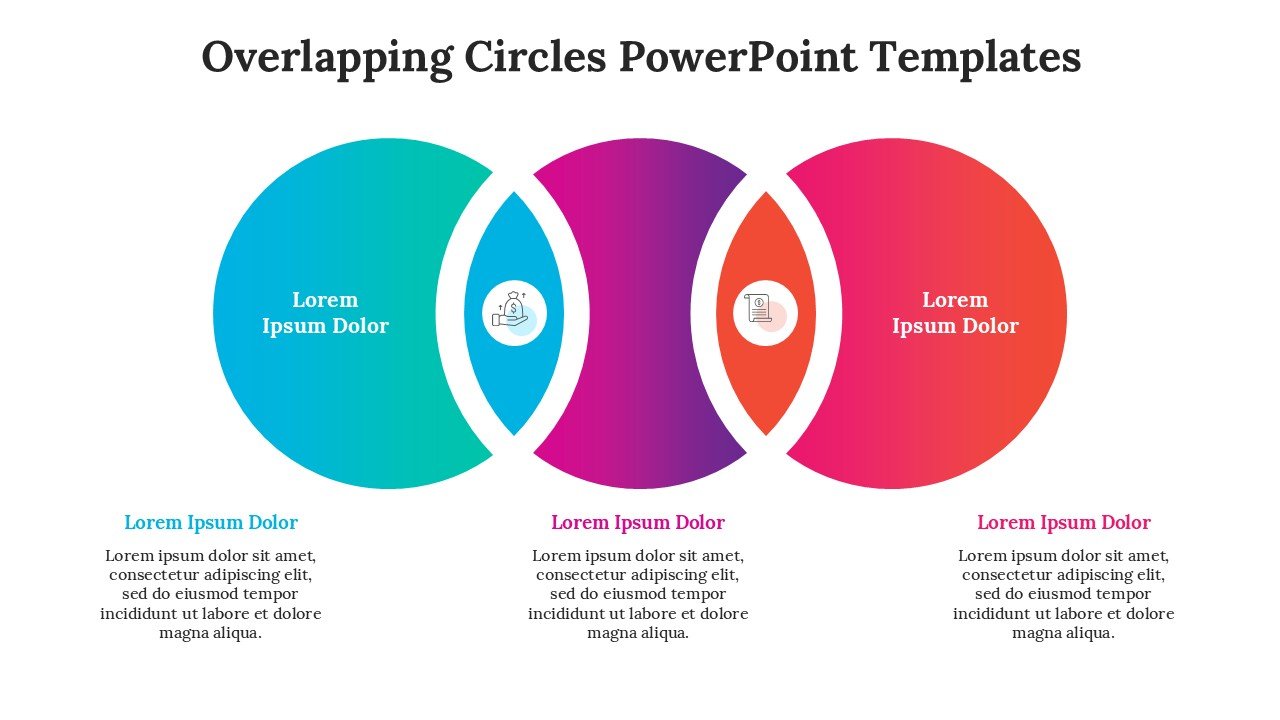
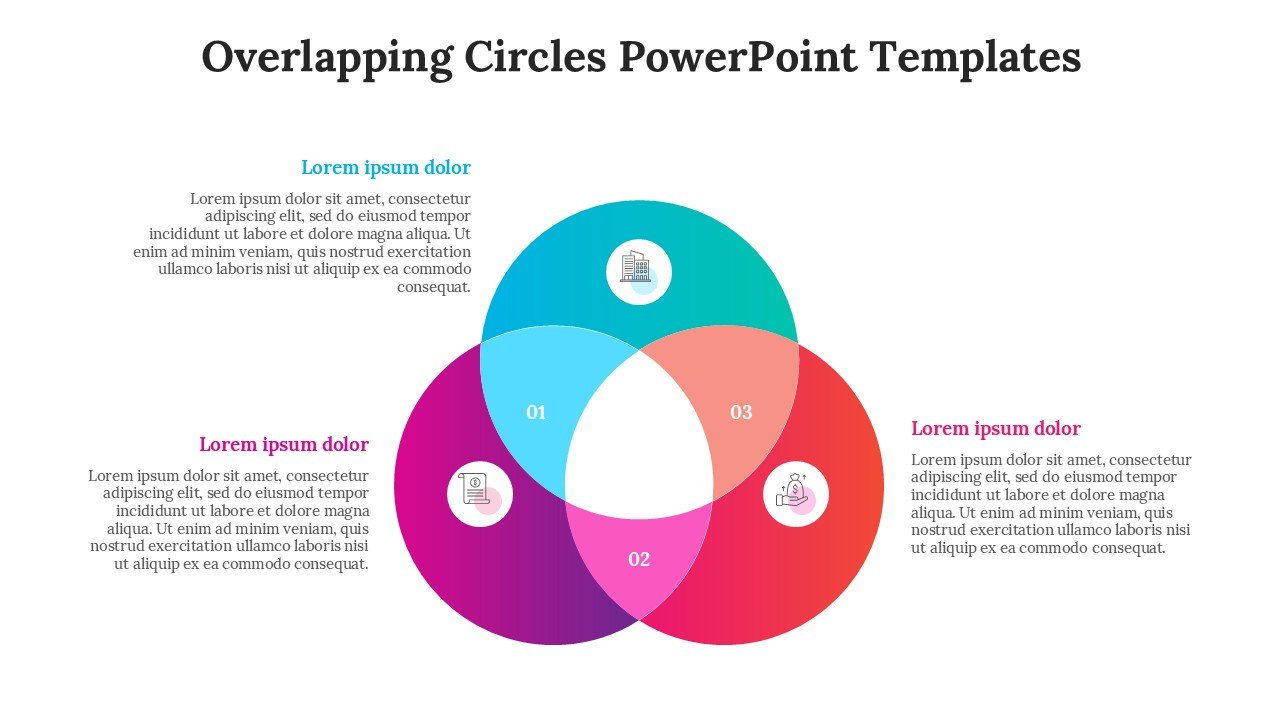
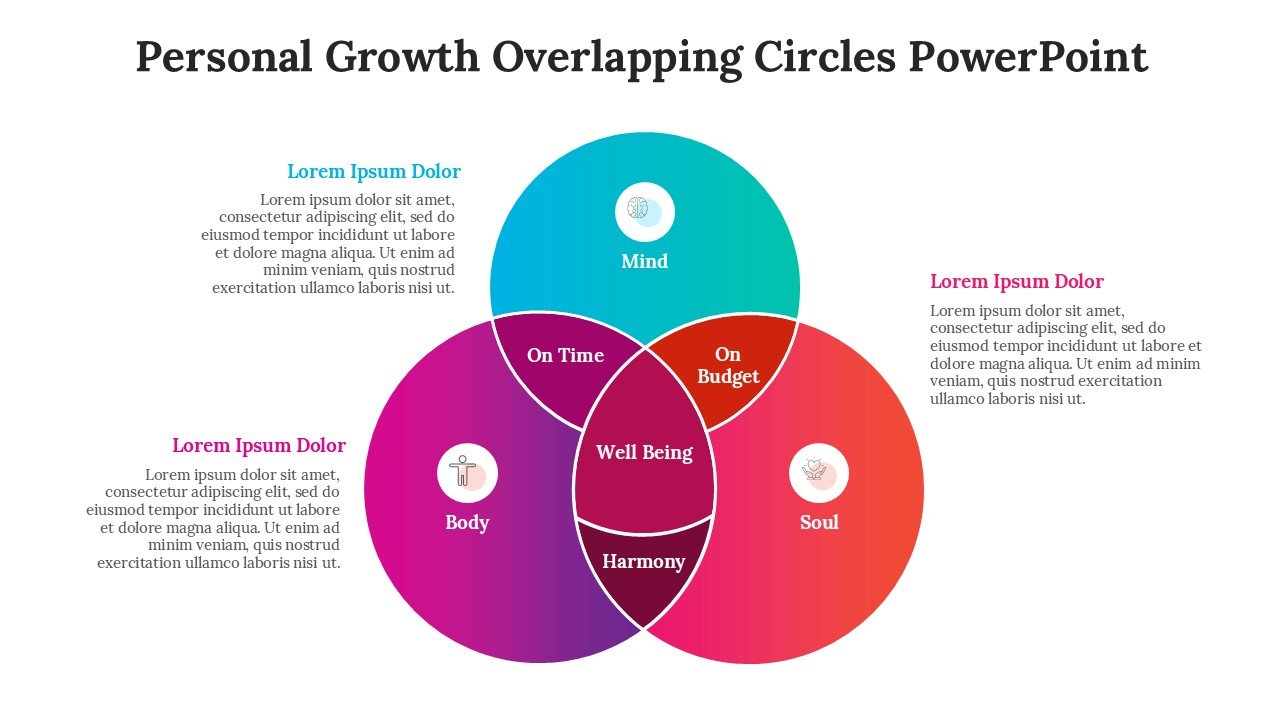
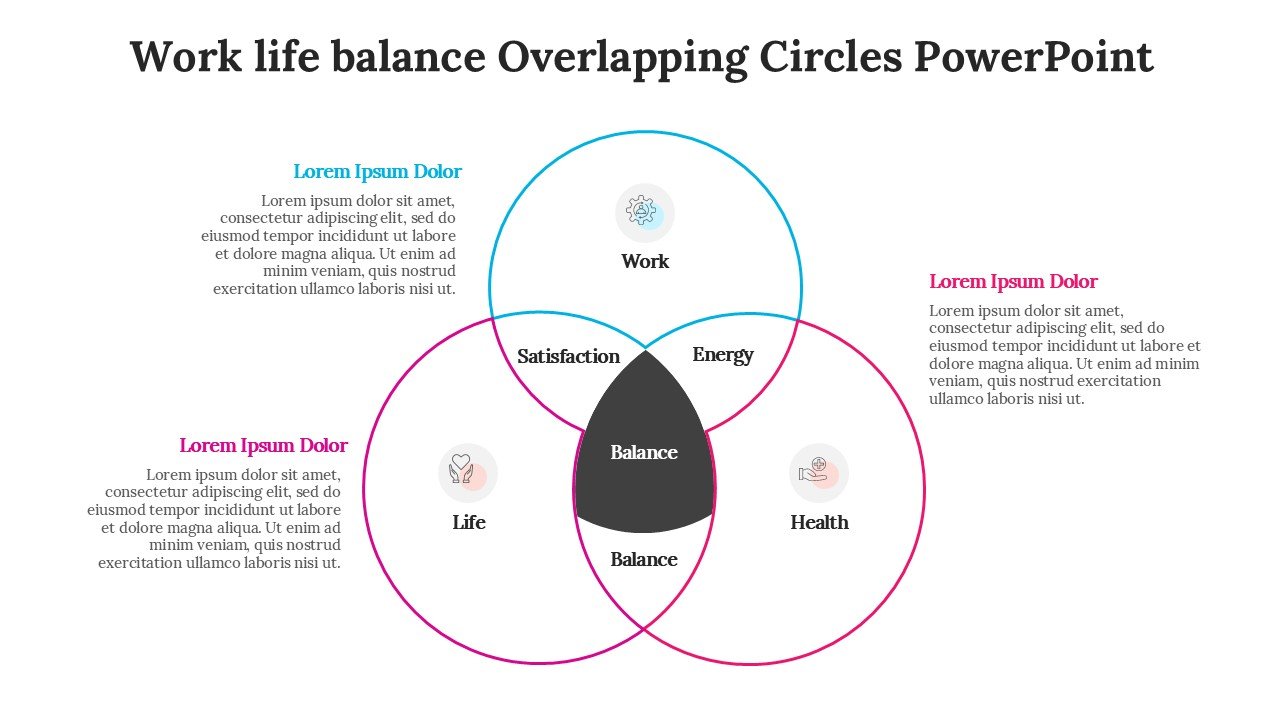
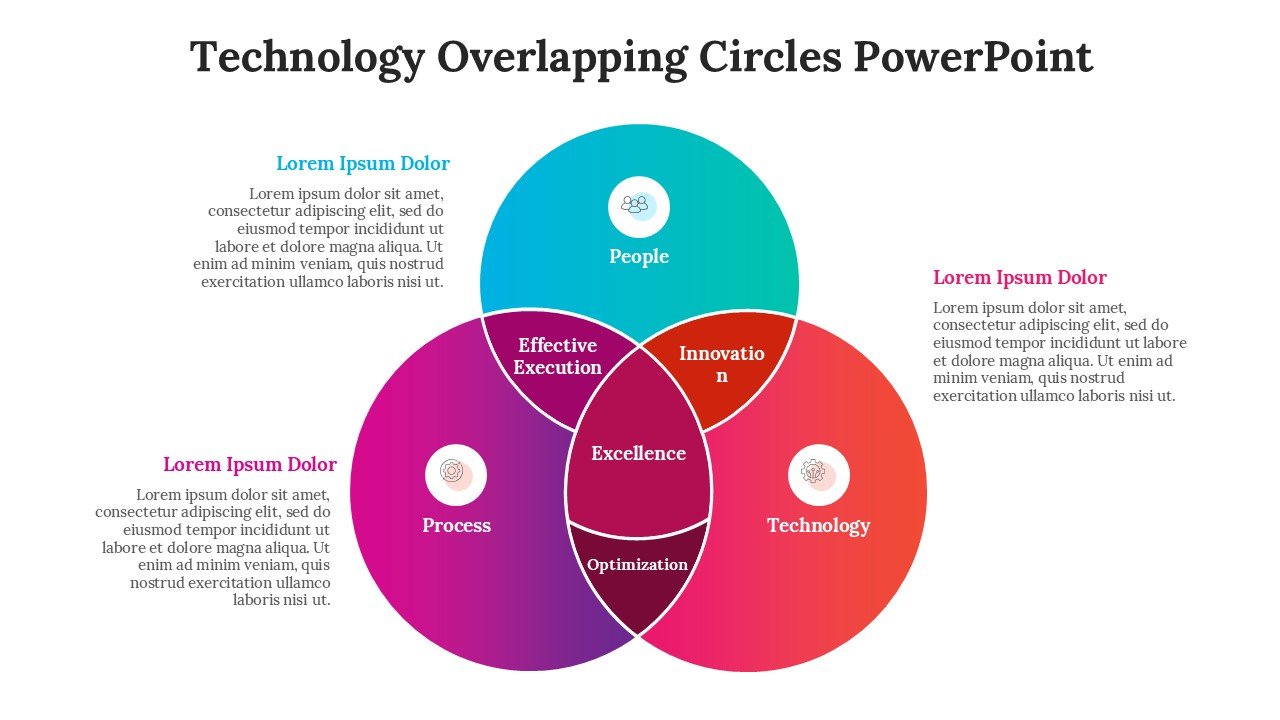
Simplify your ideas with Overlapping Circles and Venn Diagrams. Each template includes 13 different infographic slides. Have no fear about the appearance of your presentation. We picked great colors and a nice layout that Pop-Culture references to the 80’s. The focus of this template was business and process related concepts. This includes but is not limited to: comparisons, relationships, intersections, and concepts.
Being a business presentation, the focus of course, is on the content. We included a nice palette and color schemes to help differentiate concepts. There are numerous layouts to help illustrate concepts and processes. The focus of the template is business, but can certainly encompass other areas. There are numerous charts and graphics to capture and illustrate processes and other concepts.
All elements are fully editable, allowing you to customize text, colors, shapes, icons, diagrams, and data to match your presentation requirements.
Template Features:
- 13 Infographic Slides : A versatile collection of overlapping-circle, Venn diagram, comparison, process, and relationship-based layouts.
Pink, Red & Blue Gradient: A vibrant gradient palette that adds energy and visual distinction to business presentations.
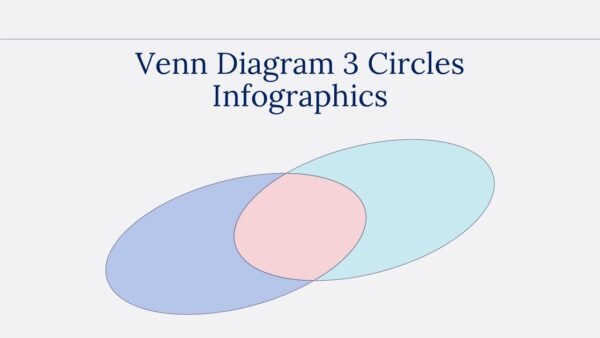
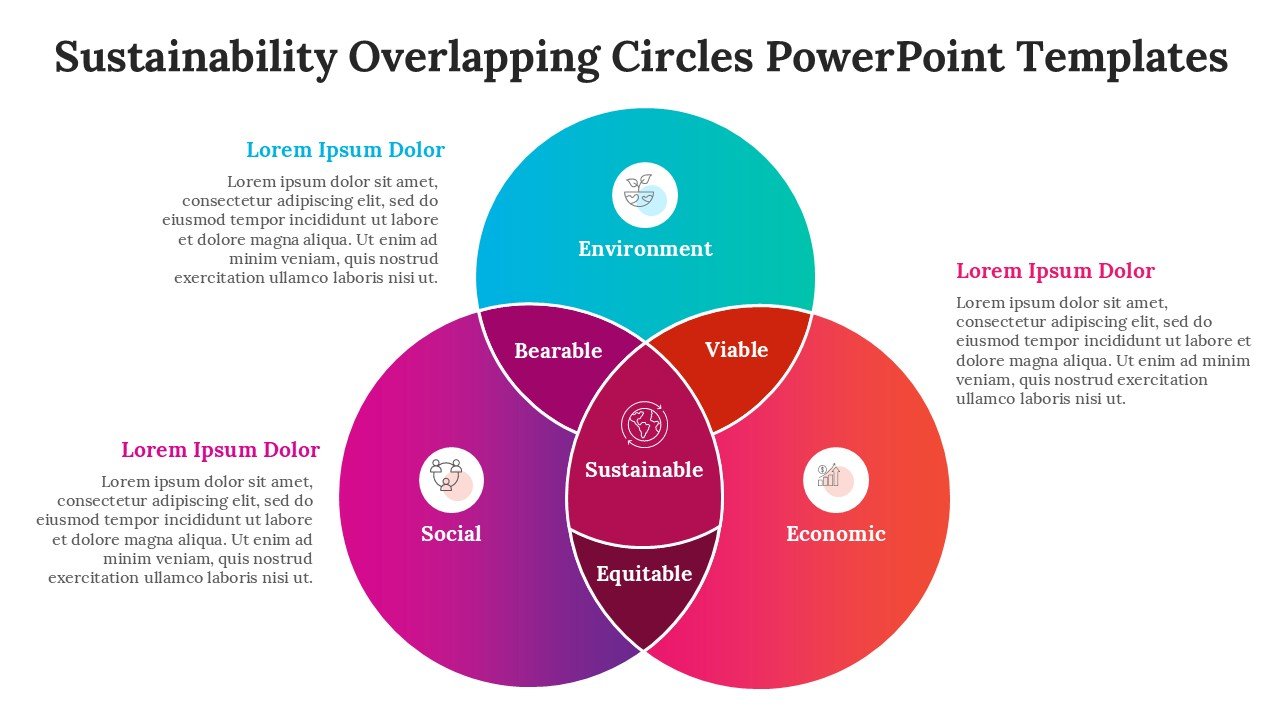
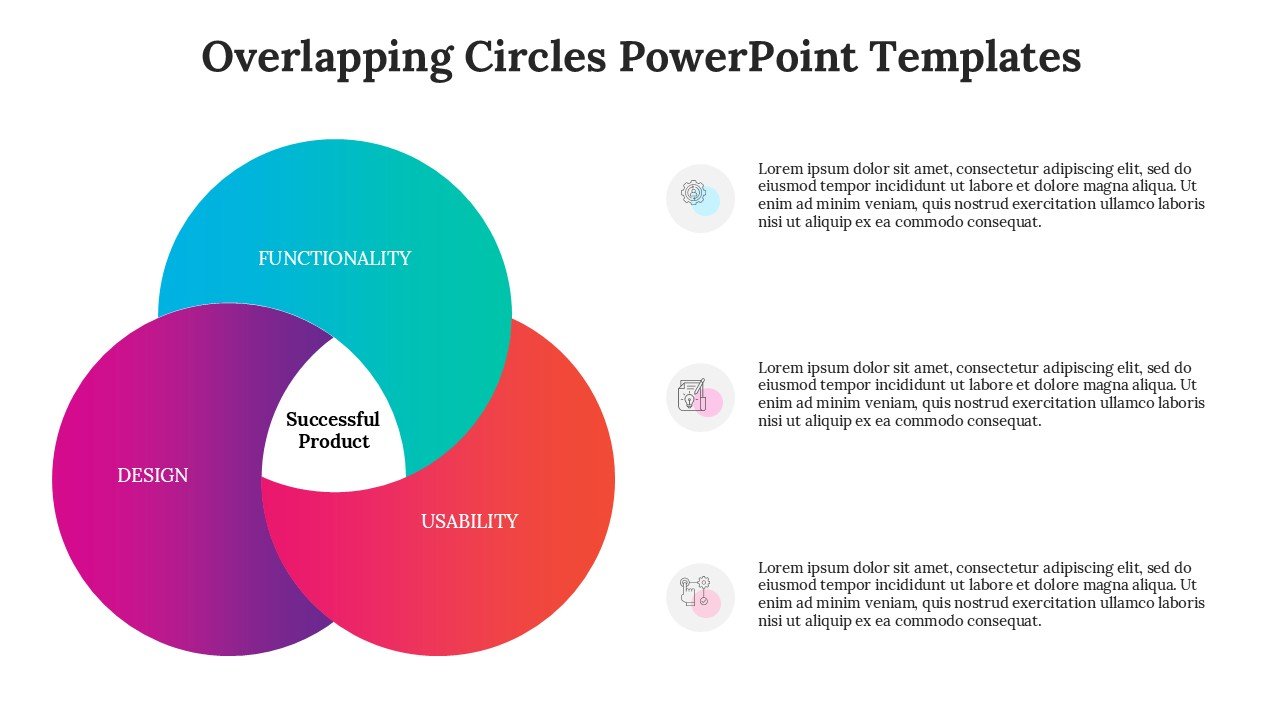
Venn Diagram & Circle Infographics : Clearly illustrate relationships, intersections, similarities, differences, and connected concepts.
Business & Step-Based Visuals : Useful layouts for business processes, workflows, strategies, stages, and sequential steps.
Modern Infographic Design: Clean, structured layouts designed for professional communication and easy information scanning.
100% Editable: Easily customize text, shapes, colors, diagrams, icons, and other visual elements.
16:9 Widescreen Format: Optimized for modern presentation screens and professional meeting environments.
PowerPoint & Google Slides Compatible: Edit and present your content using your preferred presentation platform.
Flexible Business Applications : Suitable for strategy, consulting, training, marketing, project management, process documentation, and corporate presentations.
Perfect For:
- Business Consultants & Strategy Professionals: Present strategic frameworks, business relationships, market comparisons, and decision-making models.
Corporate Managers & Executives: Communicate business priorities, organizational structures, strategic initiatives, and executive-level insights.
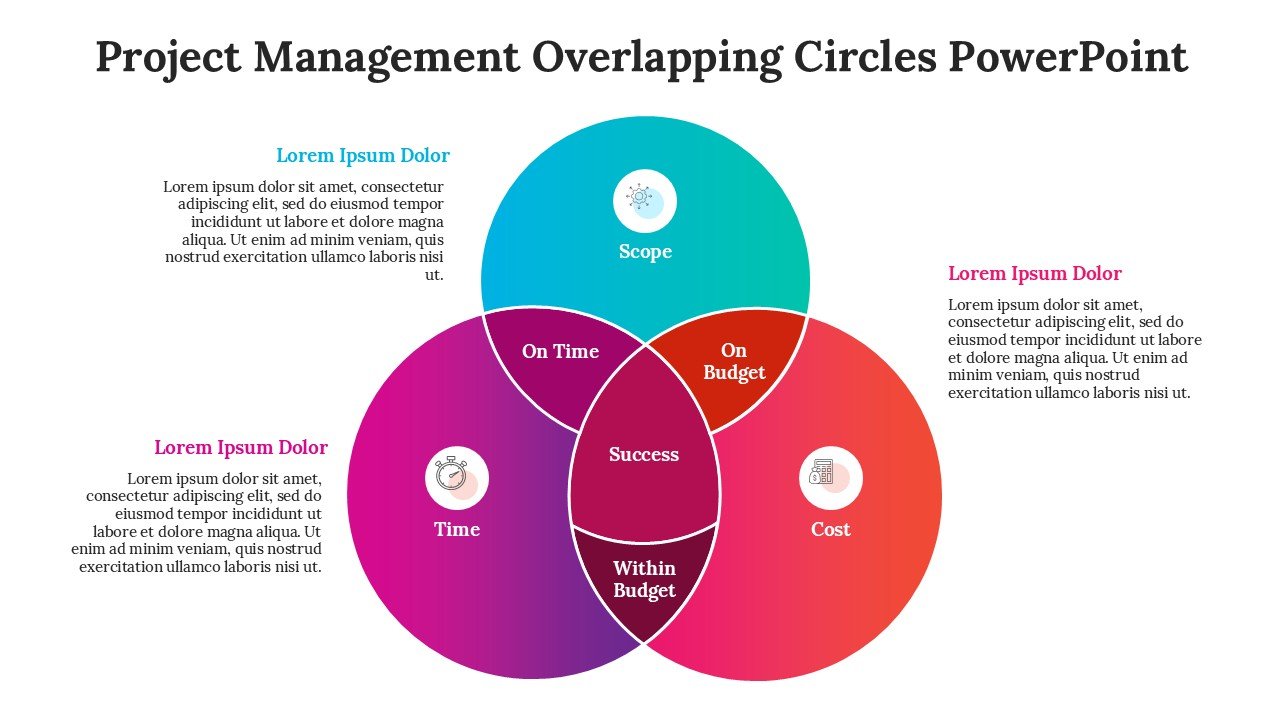
Project & Process Management Teams: Visualize project stages, workflows, dependencies, processes, and interconnected activities.
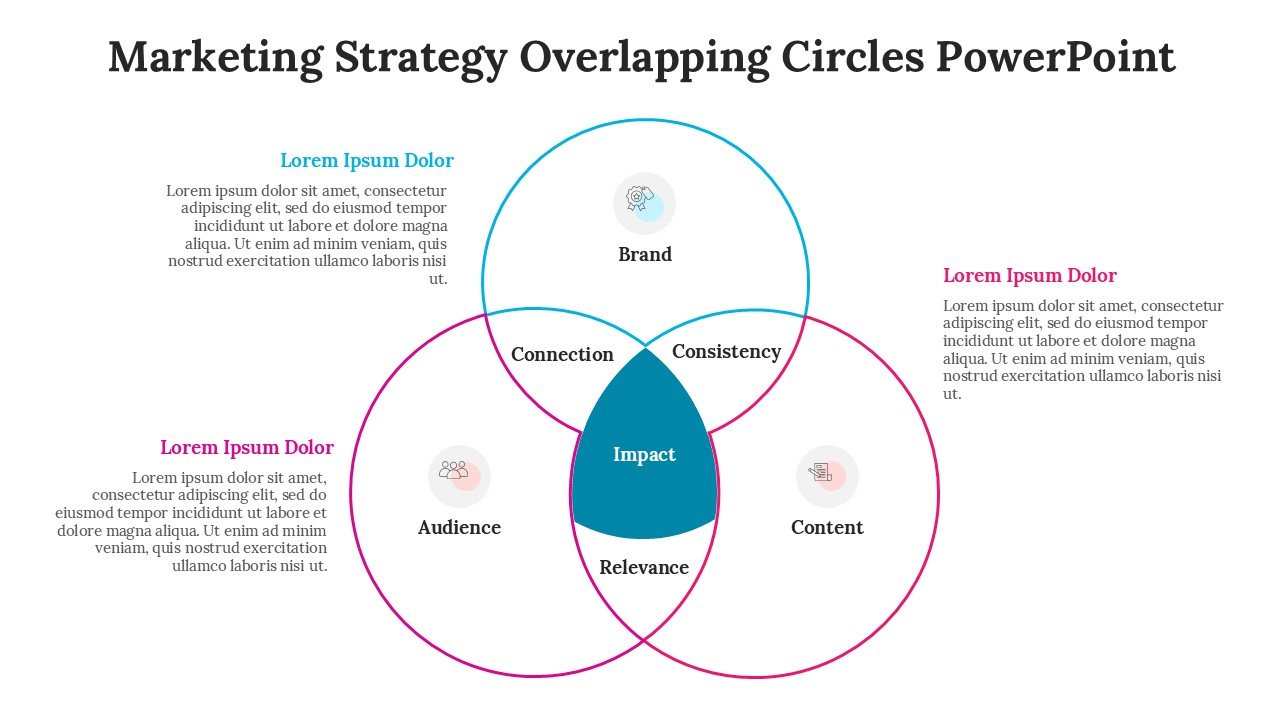
Marketing & Sales Professionals: Compare customer segments, marketing strategies, sales processes, and overlapping market opportunities.
Trainers & Workshop Facilitators: Explain concepts, processes, relationships, and step-by-step frameworks during training sessions and workshops.
Business Analysts & Researchers: Organize findings, compare data sets, identify relationships, and present analytical insights visually.
Educators & Instructors: Simplify complex concepts, comparisons, relationships, and learning processes with easy-to-understand diagrams.
Startup Founders & Entrepreneurs: Build compelling presentations for business models, strategies, market analysis, growth plans, and investor discussions.
FAQ’s
Can I modify all 13 infographic slides?
You can customize as many elements as you wish, including text, shapes, colors, and slides.
Are there layouts for showing business processes?
Yes, the templates provide multiple ways to show steps and processes.
Can I change the colored gradients?
Yes. The color elements can be customized to match your brand guidelines, corporate colors, or presentation theme.
Can the color elements be modified to my specifications?
Yes. Our templates are designed to allow you to modify color elements to your brand colors or presentation style.
How are Venn Diagrams used?
Venn Diagrams allow you to illustrate relationships, philosophies, etc., through similarities, differences and other forms of relations and equivalence.
Are the examples of inter-relationships in the Venn Diagrams restricted to business only?
No. Our templates allow you to illustrate various forms of relationships in fields as diverse as Arts, Sciences, Humanities and the Law.
Can I use the template to create Consulting/Strategy Presentations?
Yes, our format allows you to create PowerPoint presentations for Consulting/Strategy Reports, and other Business documents.
Can I edit the circles and other elements of the diagrams?
Yes. You are at liberty to edit any and all elements of our diagrams as you see fit.
In what formats can I use the presentation?
Our templates are designed to be used in PowerPoint and Google Slides.



 MS Powerpoint
 Google Slides