Semi circle Diagram Steps 2 to 8 Infographics Presentation
Premium
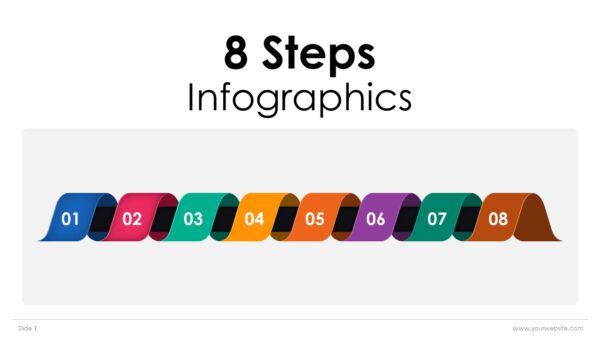
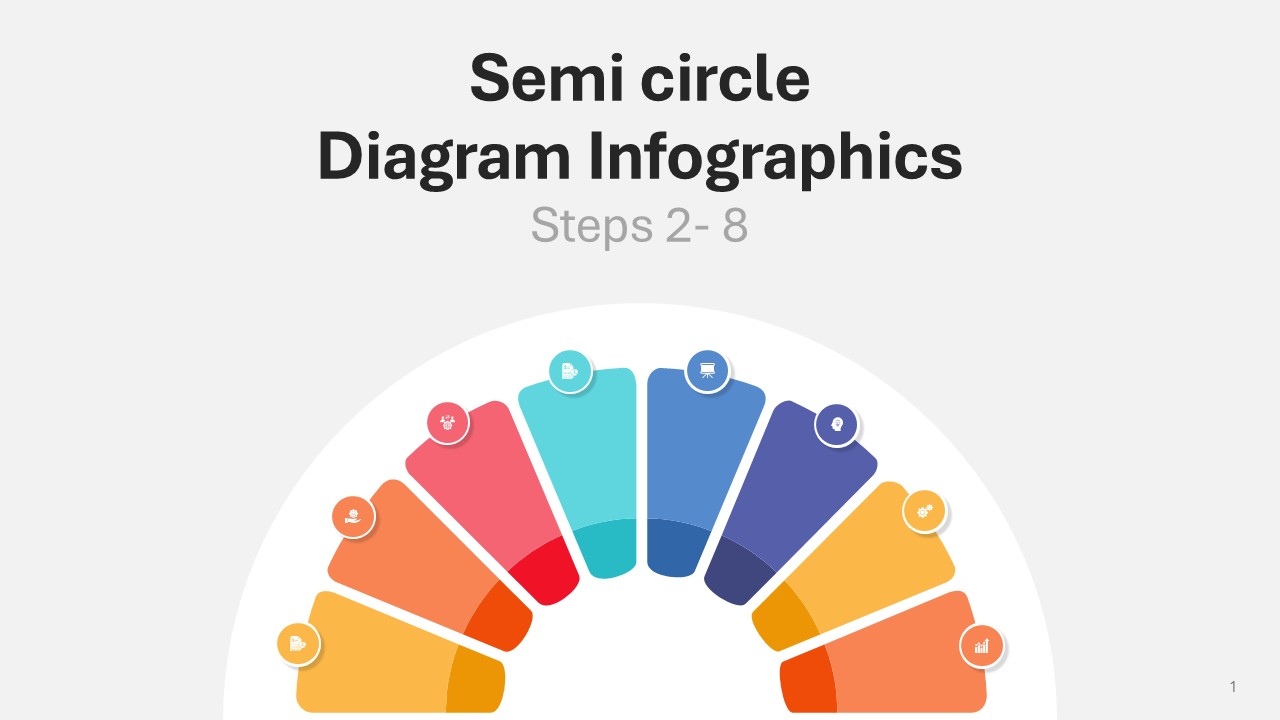
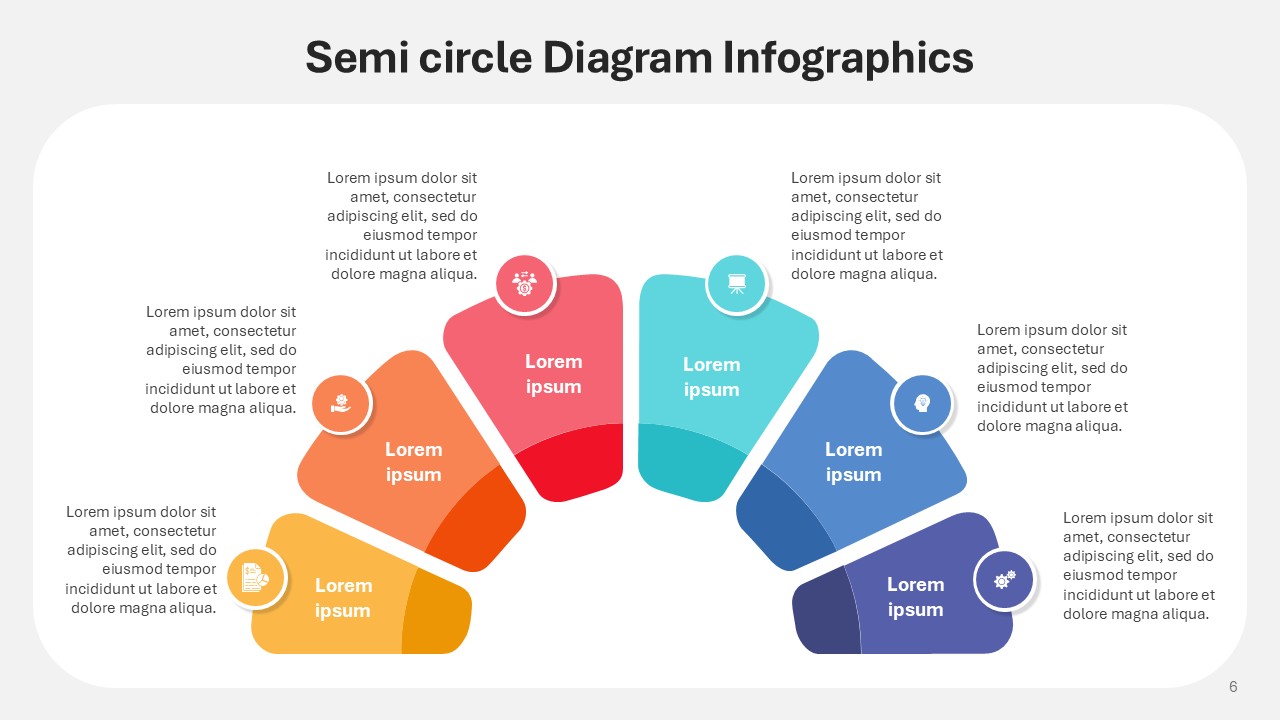
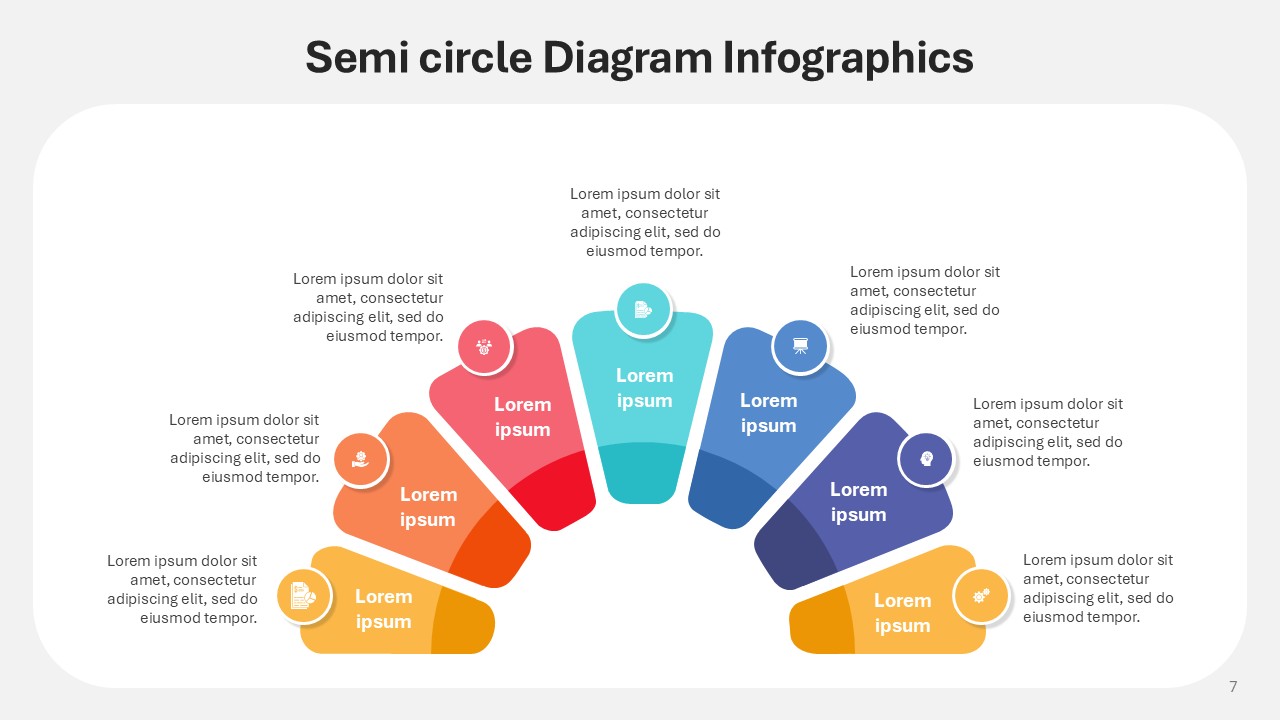
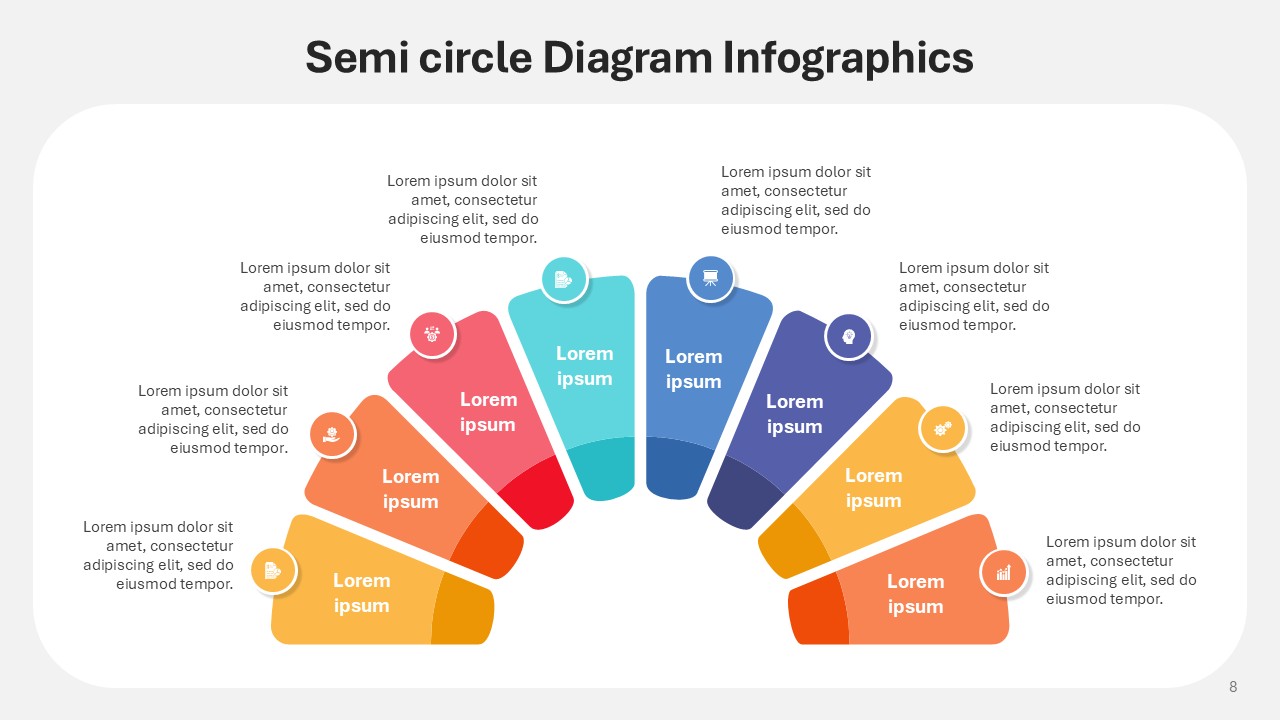
The Semi Circle Diagram Steps 2 to 8 Infographics Presentation offers a range of pre-designed and polished slides each of which is dedicated to describing intricate processes in a simple and appealing manner. These slide packs make it easy to present from 2 to 8 steps of a multi-step process while maintaining balance. Each slide in this presentation template gives a clear sequence and visual flow of a process that is easy to follow—a versatile design set.
Each step in a process is aimed to be highlighted using a set of primary and secondary range colors. These primary colors have been structured to allow a free flow of context from step to step. Each time step is shown termed is highlighted through primary colors with secondary colorakers surrounding it. red is used to start and awe people to the action of step one. orange is used to give movement to the action of step. yellow is used to put importance to the golden actions which scope the essence that underlies the given thought. green is used in the scope of metrics and metrics that indicate periods of growth. blue is used to give the give logic and structure and to rub off the scaffolding of trust.
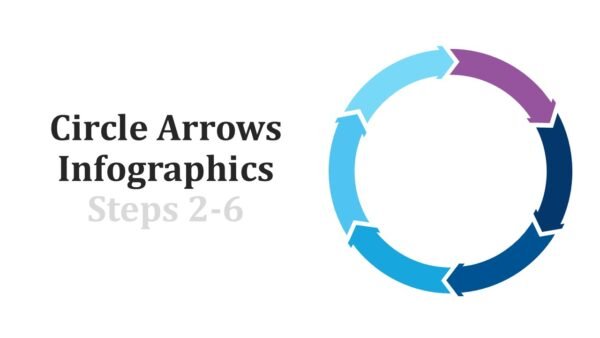
The presentation template offers the speaker aid that has a fluent structure and logical sequence that helps to outline the process and workflow. The semicircle design uninterruptedly and effortlessly is indicative of circular logic which eases the understanding of the viewer whilst keeping the context and structure neat. All steps of the process furnish the speaker with the opportunity to put correlating images to the context and place simplistic flow of the visuals.
In PowerPoint, each component, including icons, copy, and hue, can all be adjusted and personalized, allowing one’s brand to be easily incorporated, and the graphic aligned to the desired content. It is ideal for executives, consultants, educators, marketers, and any groups requiring the streamlining of complex information while maintaining depth.
The Semi Circle Diagram Steps 2 to 8 Infographics Presentation can be downloaded from our site. It visually narrates content that is organized in steps. This graphic template allows for eloquent and confident delivery regardless of the audience, making it ideal for external presentations, internal discussions, and stakeholder meetings.
SlidesBrain offers presentation features that allow you to customize every aspect of your slides. This means you can modify text, images, colors, fonts, and icons to your liking. Additionally, adjusting graphs in PowerPoint is simple, enabling you to change colors, numbers, and labels to match your preferences and create the perfect presentation.
Looking for a slide or PPT that’s uniquely yours? Our presentation design agency is here to help make your ideas a reality. As a leading presentation design company, we focus on delivering premium-grade bespoke presentations that engage your audience and ensure message retention. Kindly get in touch with us for professional custom presentation design services and transform your brand’s message for the purpose that you have in mind.
“A review from a customer who benefited from your product. Reviews can be a highly effective way of establishing credibility and increasing your company's reputation.”
★★★★★Rated 5 out of 5
“A review from a customer who benefited from your product. Reviews can be a highly effective way of establishing credibility and increasing your company's reputation.”


 MS Powerpoint