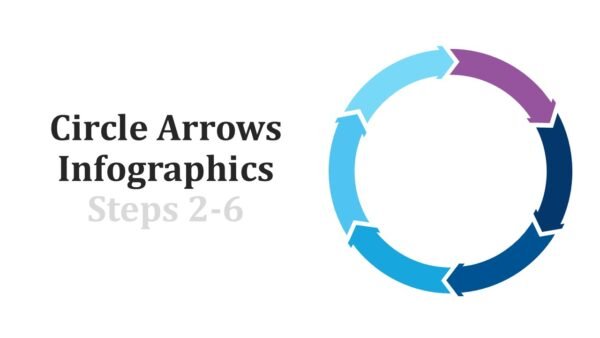
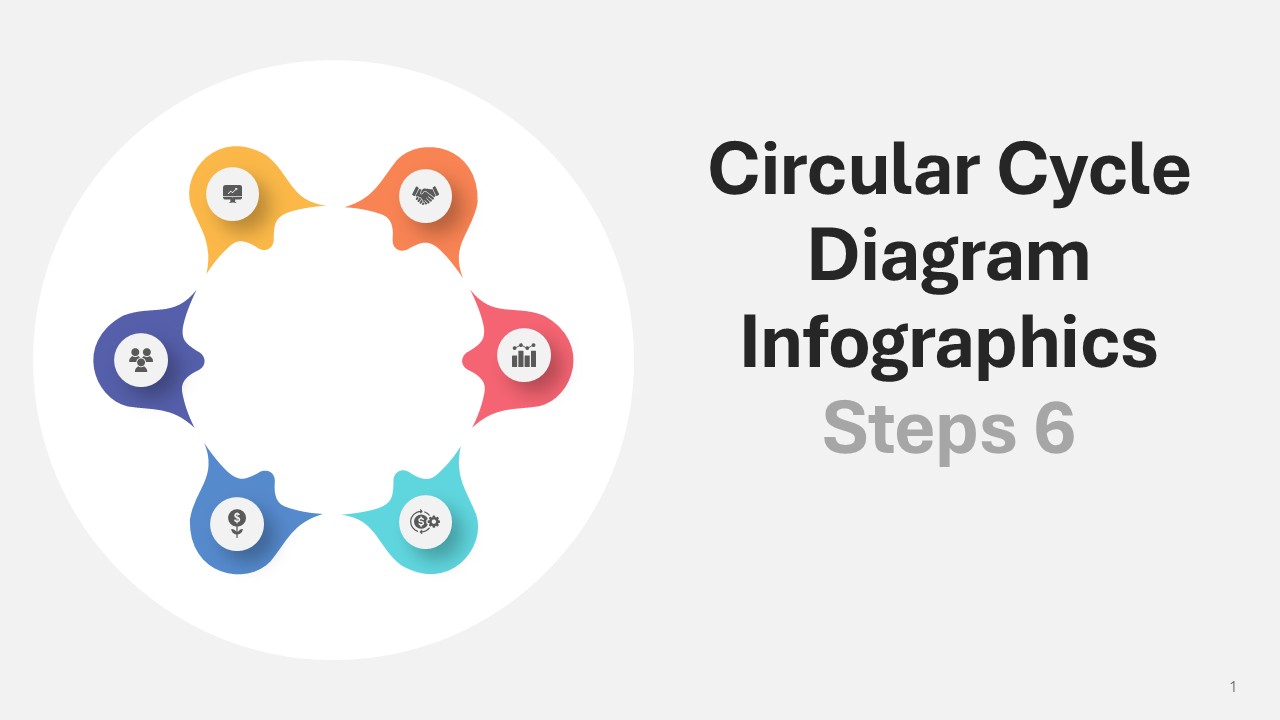
The Circular Cycle Diagram Steps 6 Infographics PPT Template infuses life into cyclical narratives with infographics on 13 ingeniously designed slides. It powers complex workflows and transforms them into intricate self-sustaining visual ecosystems using chromatic spectra of ignition yellow, catalytic orange, intensity red, innovation cyan, and resolution blue. This template serves educators, engineers, and strategists. It seamlessly integrates “ideate-prototype-test-launch-scale-optimize” into orbiting structures ensuring progression is palpable and calculable.
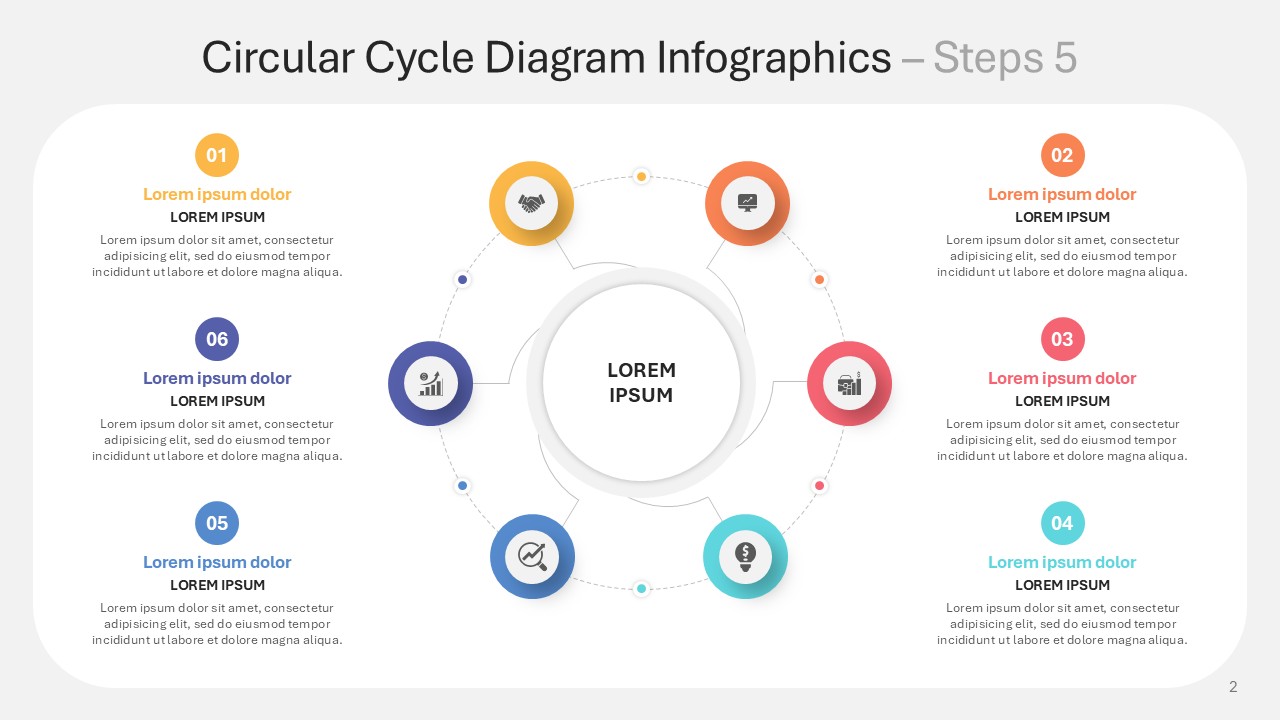
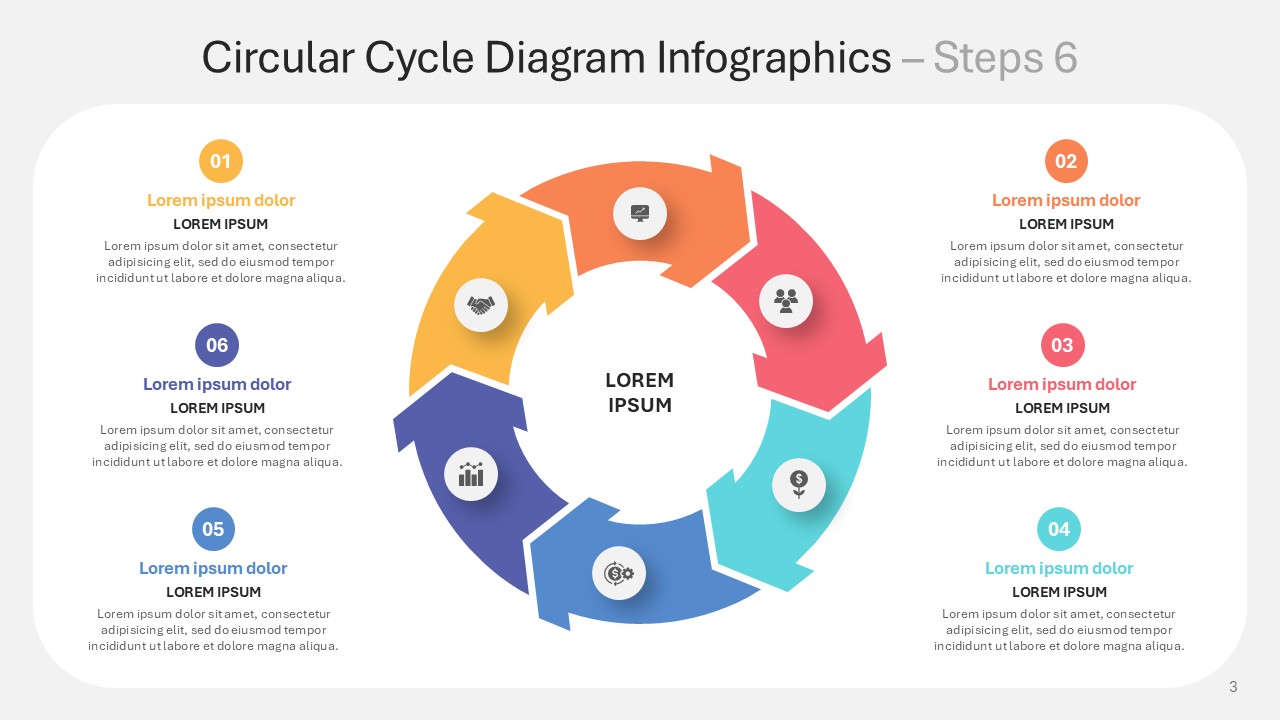
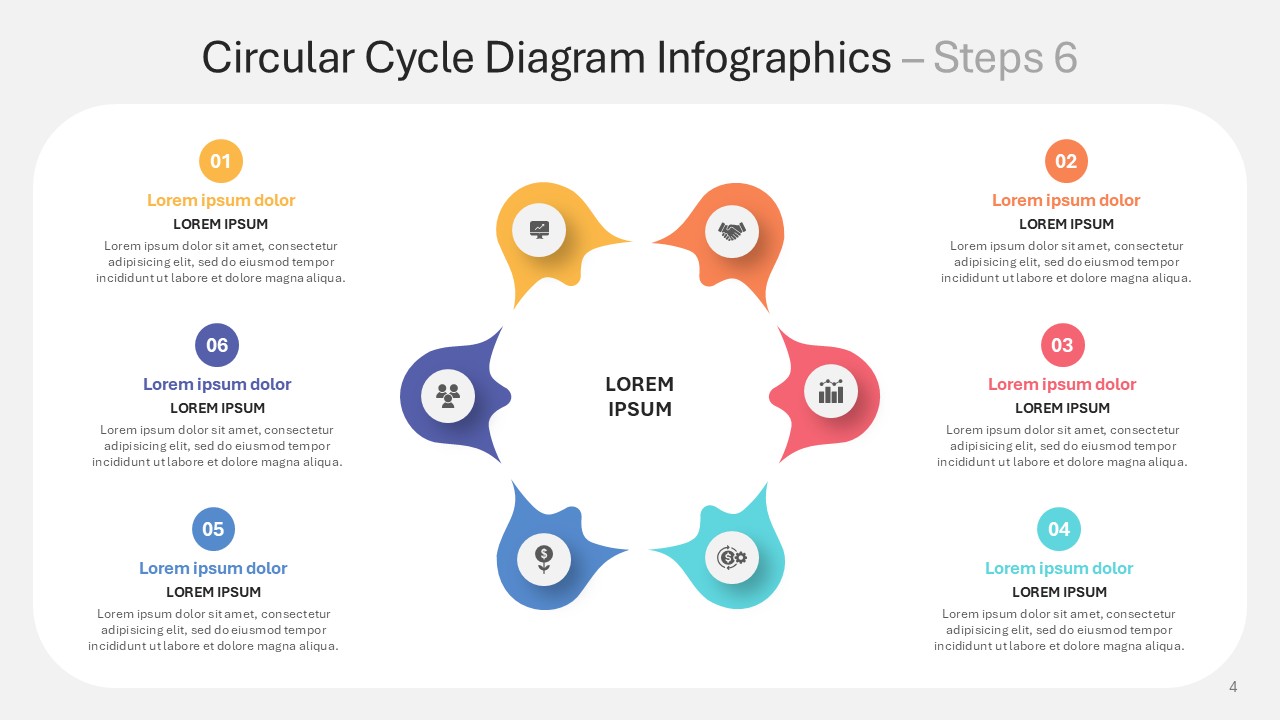
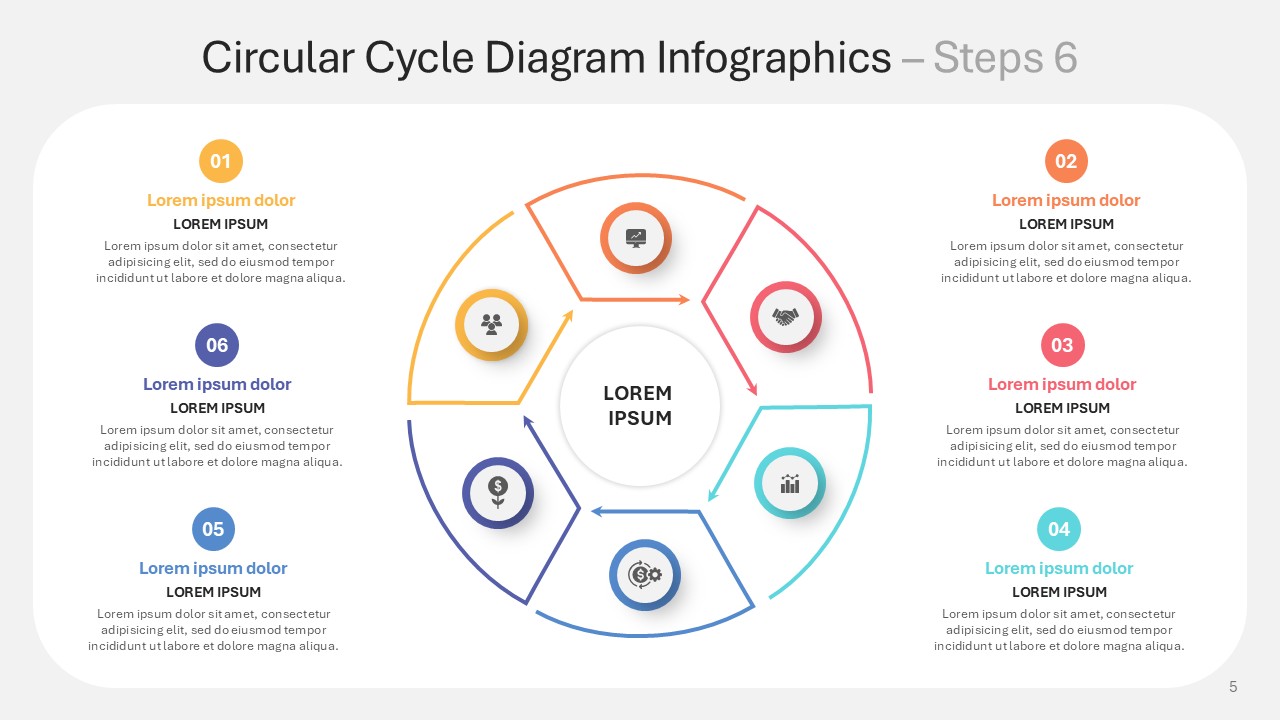
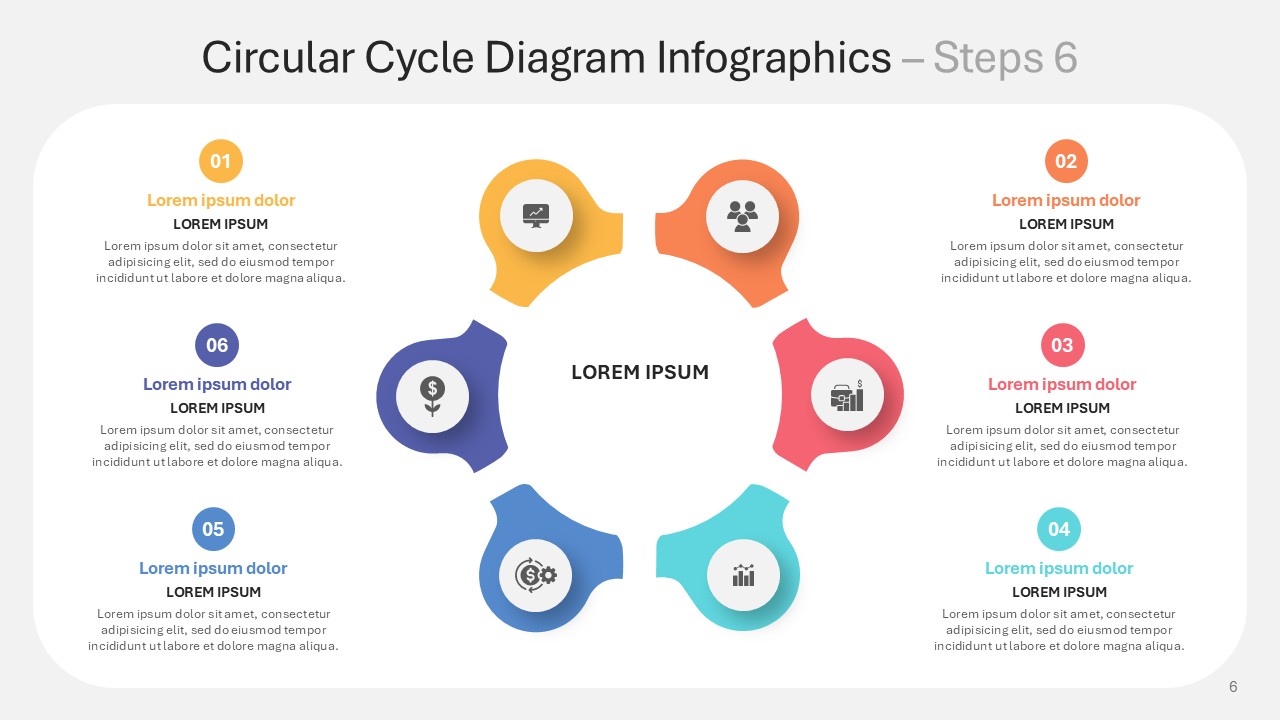
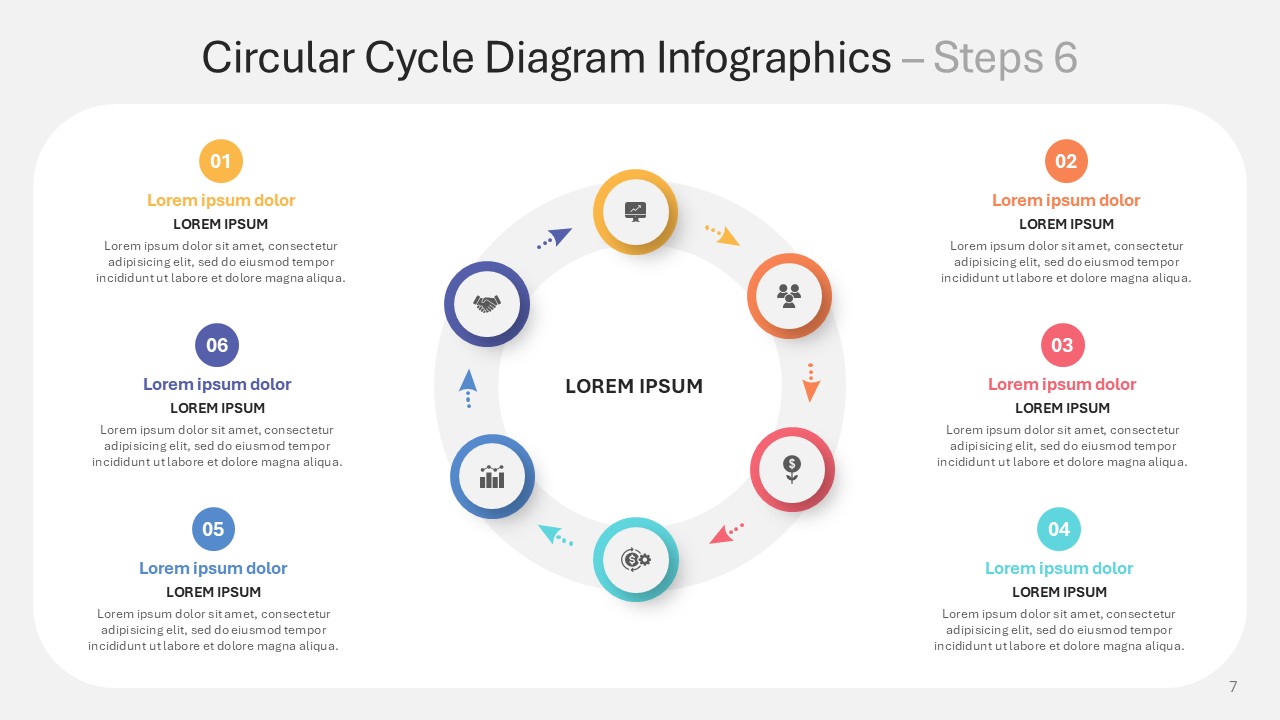
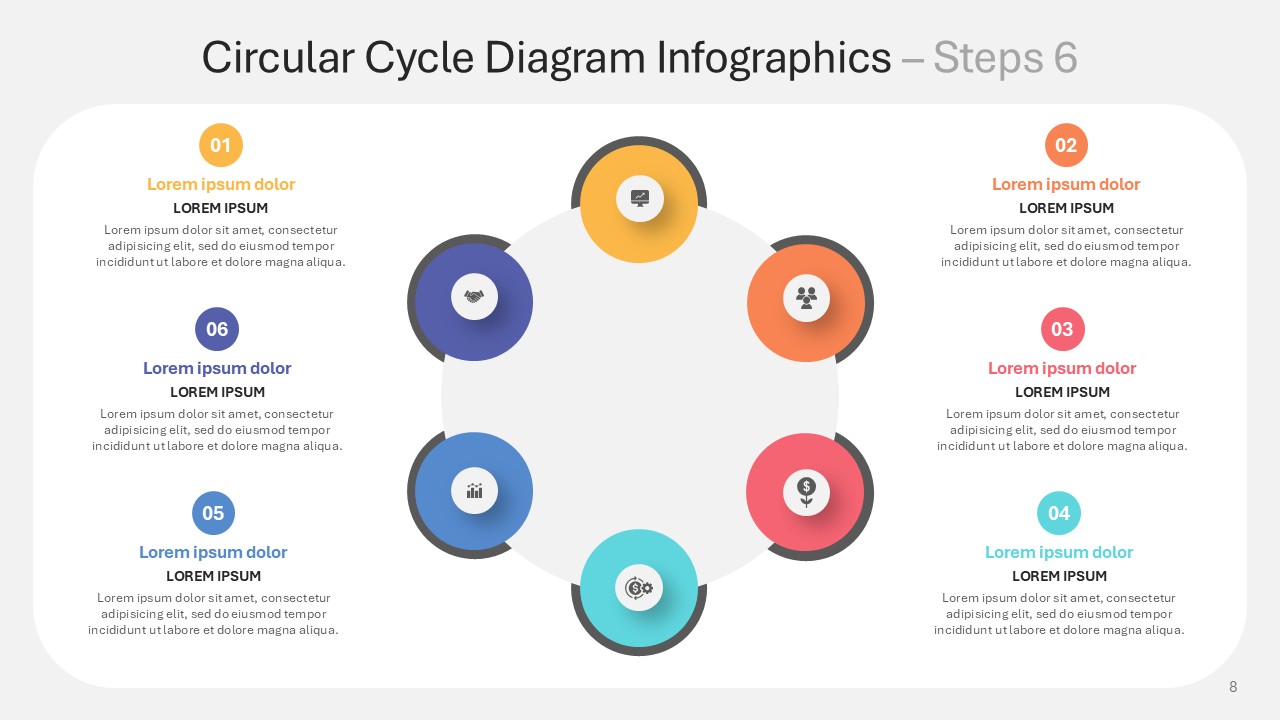
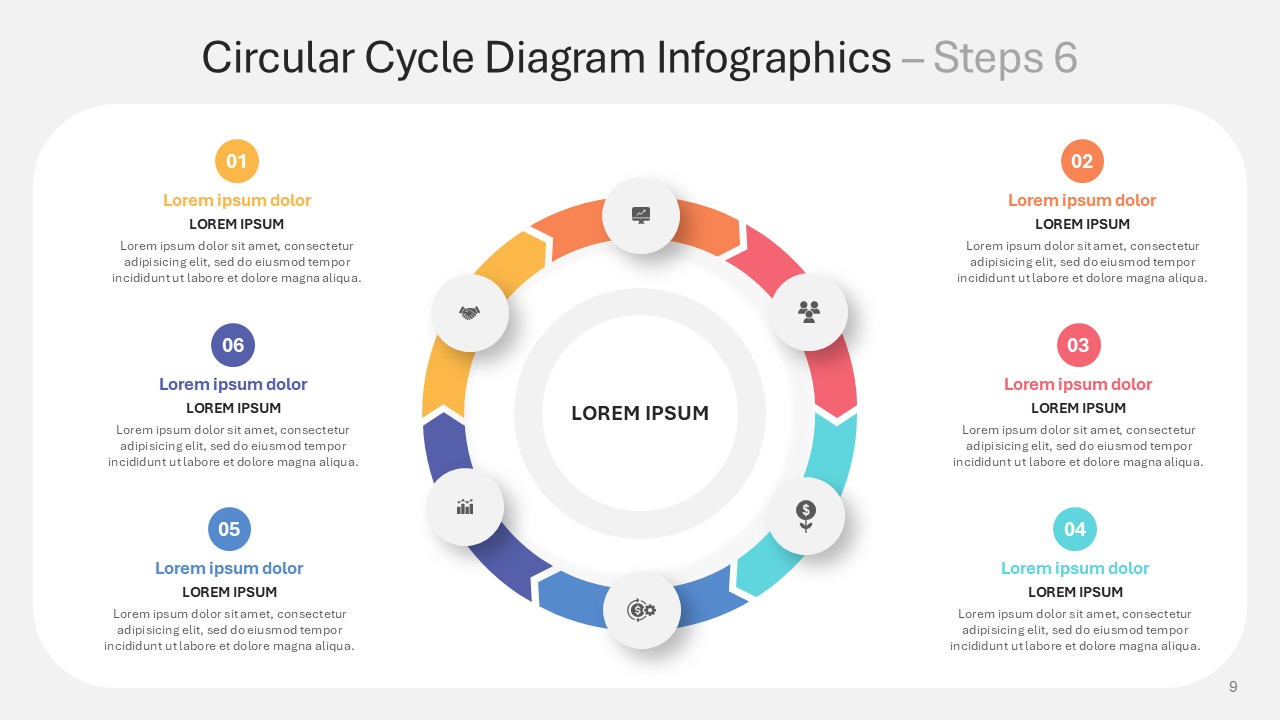
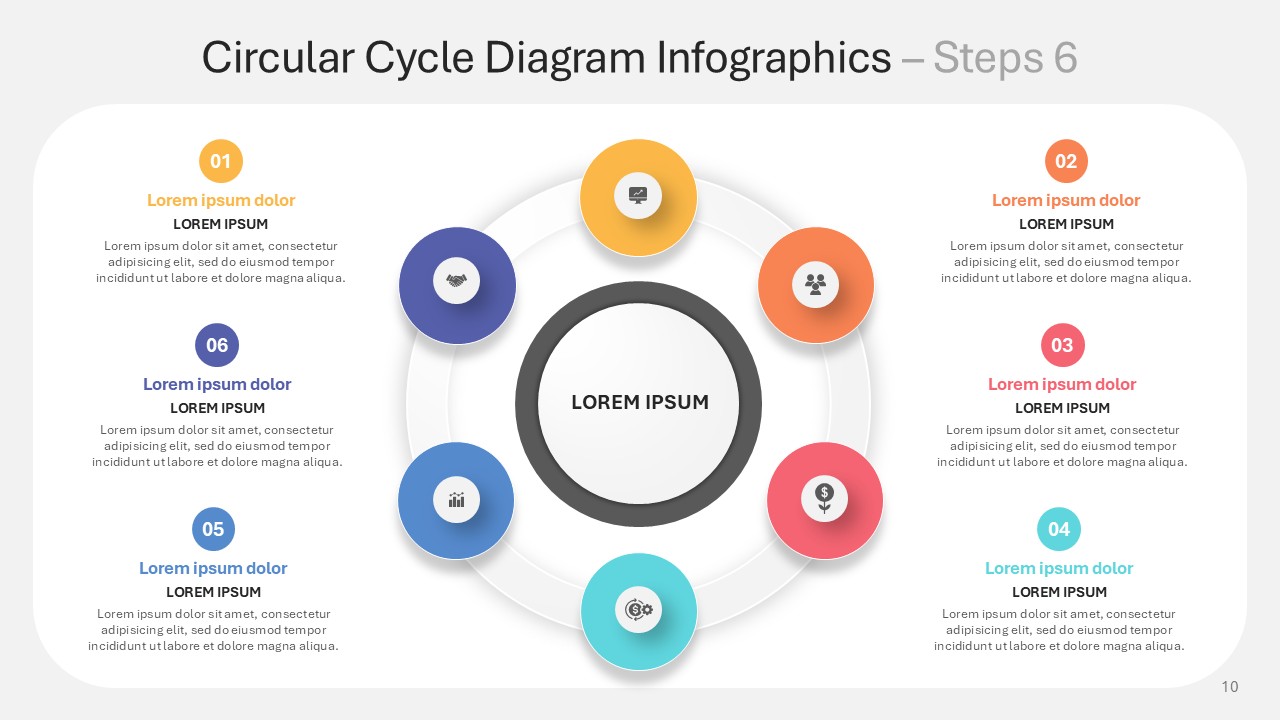
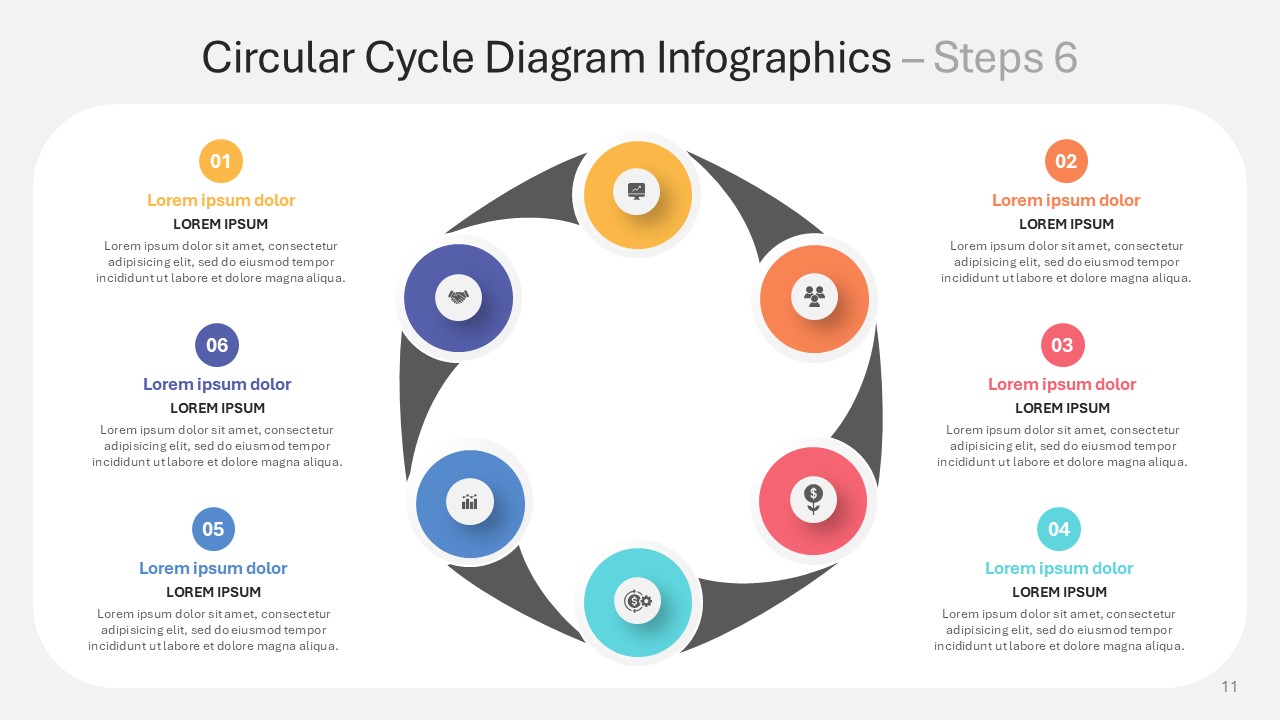
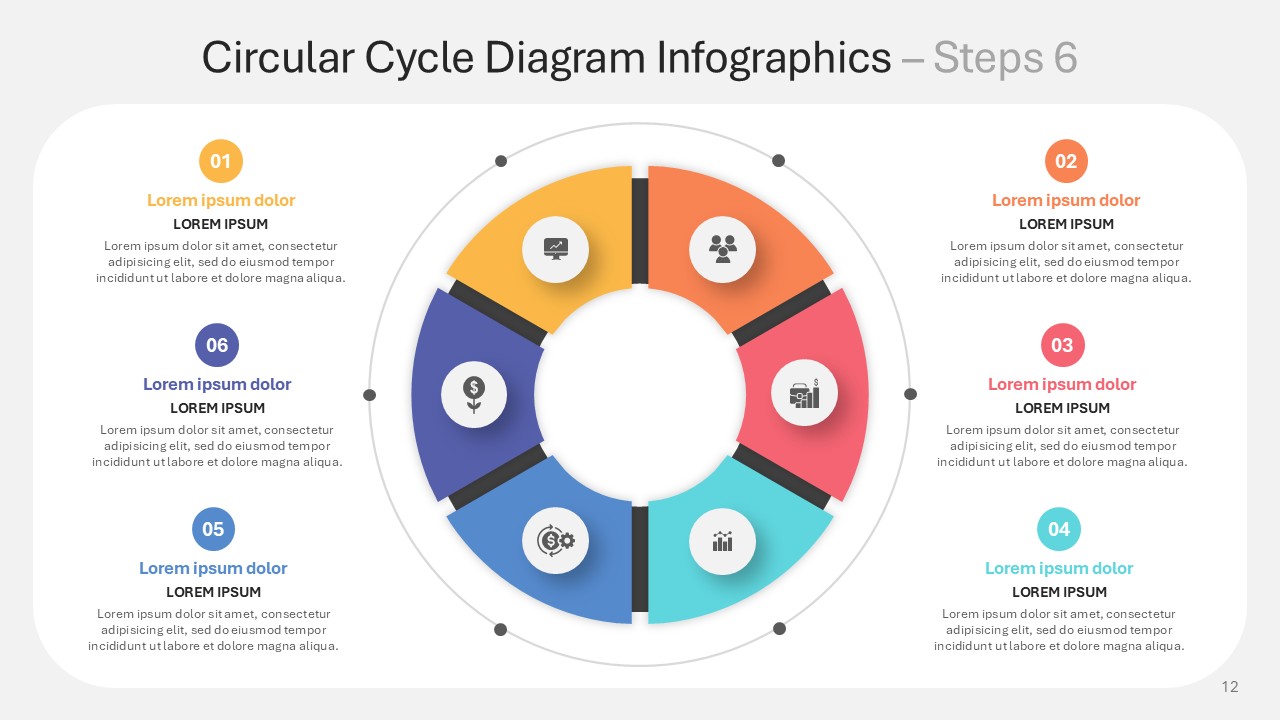
The Circular Cycle Diagram Steps 6 Infographics PPT Template conquers advanced process mapping using six-phase design as its backbone. Each of the six slides contains a cycle breakdown into the following concentric steps: conception (yellow), development (orange), validation (red), integration (cyan), scaling (blue), and optimization (indigo). Prepare yourself for rotating gear constellations, interlocking hexagonal modules, and radial progression arcs that delineate everything from R&D pipelines to frameworks for continuous improvement. This template is the epitome of failing simpler models. It is all about the feeling of control and cohesion in the iterative process of innovation.
Yellow sparks ideation energy, orange fuels prototyping momentum, red drives validation rigor, cyan enables system integration, blue anchors sustainable scaling, indigo sharpens optimization. This thermodynamic gradient is as scientific as it is precise. Yellow wedges denote research phases, orange arcs capture development, red segments indicate the intensity of testing, cyan quadrants monitor implementation, blue zones capture growth, while indigo layers refine perfection.
Shift your workflow seamlessly into this framework in PowerPoint or Google Slides. Replace placeholder icons with relevant industry assets, adjust phase colors to align with ecosystem branding, or compress and expand based on operational reality. The Circular Cycle Diagram Steps 6 Infographics PPT Template offers customizable templates for PDCA cycles, innovation funnels, and growth flywheels with no design restrictions.
Perfect for manufacturing directors designing quality control loops, technology leaders depicting DevOps pipelines, sustainability officers illustrating circular economies, or educators explaining intricate biological systems. The Circular Cycle Diagram Steps 6 Infographics PPT Template is essential when documenting for Six Sigma as well as in digital transformation roadmaps and investor reports that require multi-layered intricate visual detailing of telemetry granularity.
Download the Circular Cycle Diagram Steps 6 Infographics PPT Template will allow you to transcend linear structures. Change disjointed workflows into self-contained systems where advancements render themselves as visual certainties, all while achieving sublime simplicity in the midst of intricate systems.


 MS Powerpoint