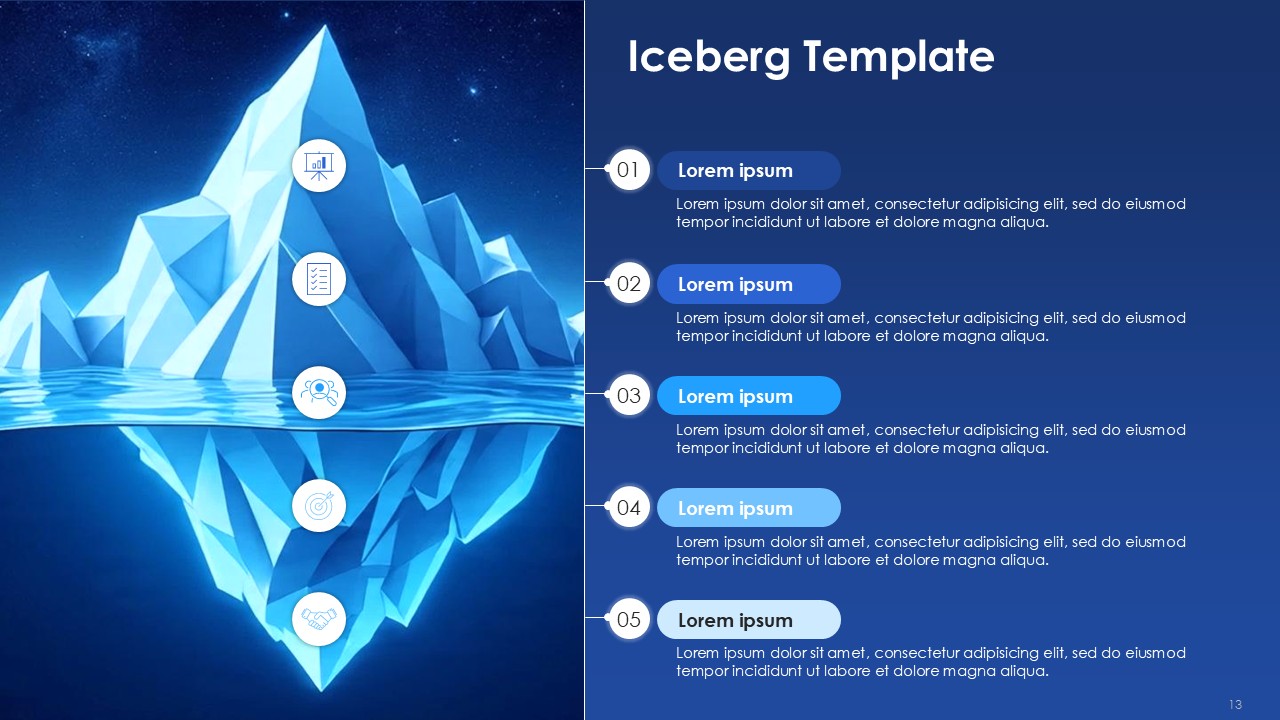
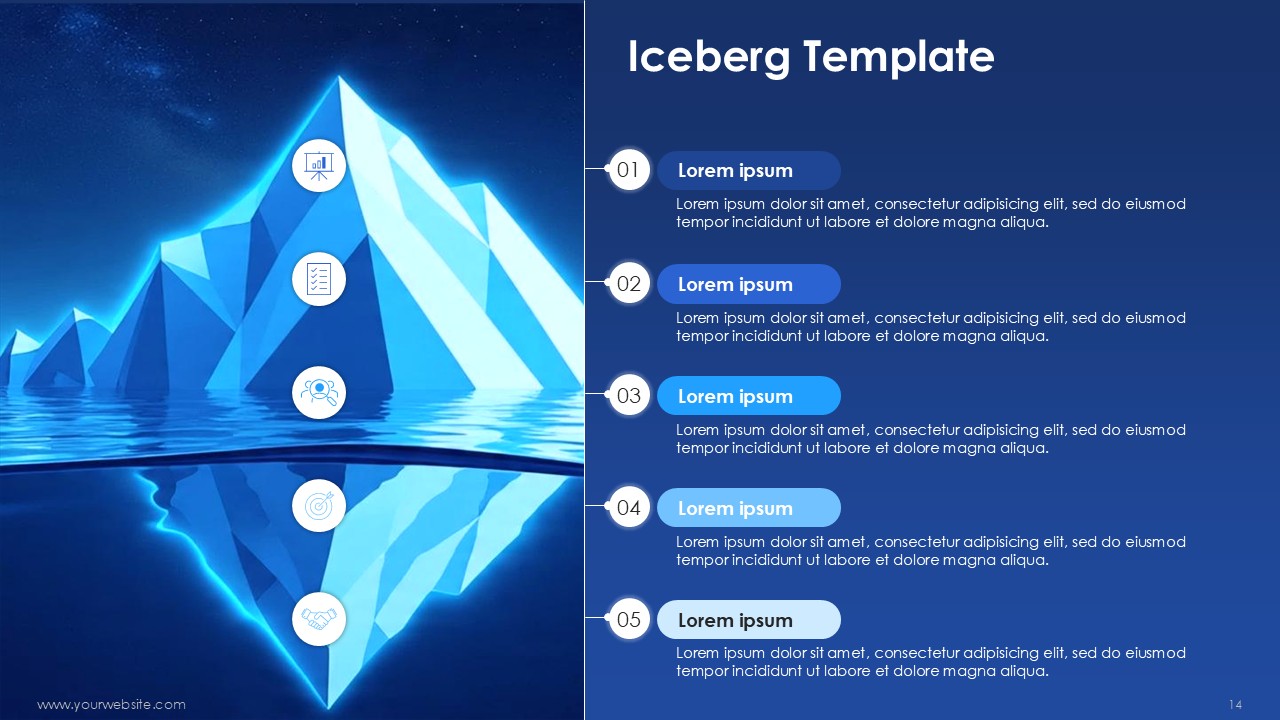
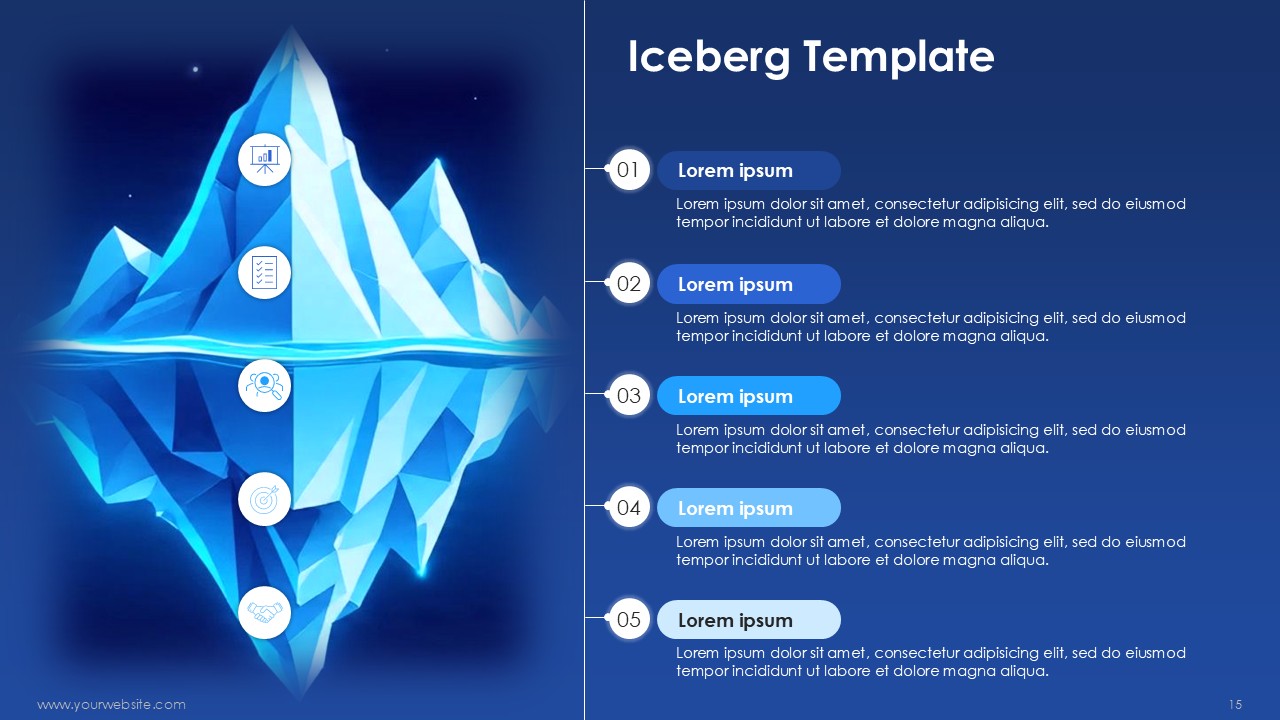
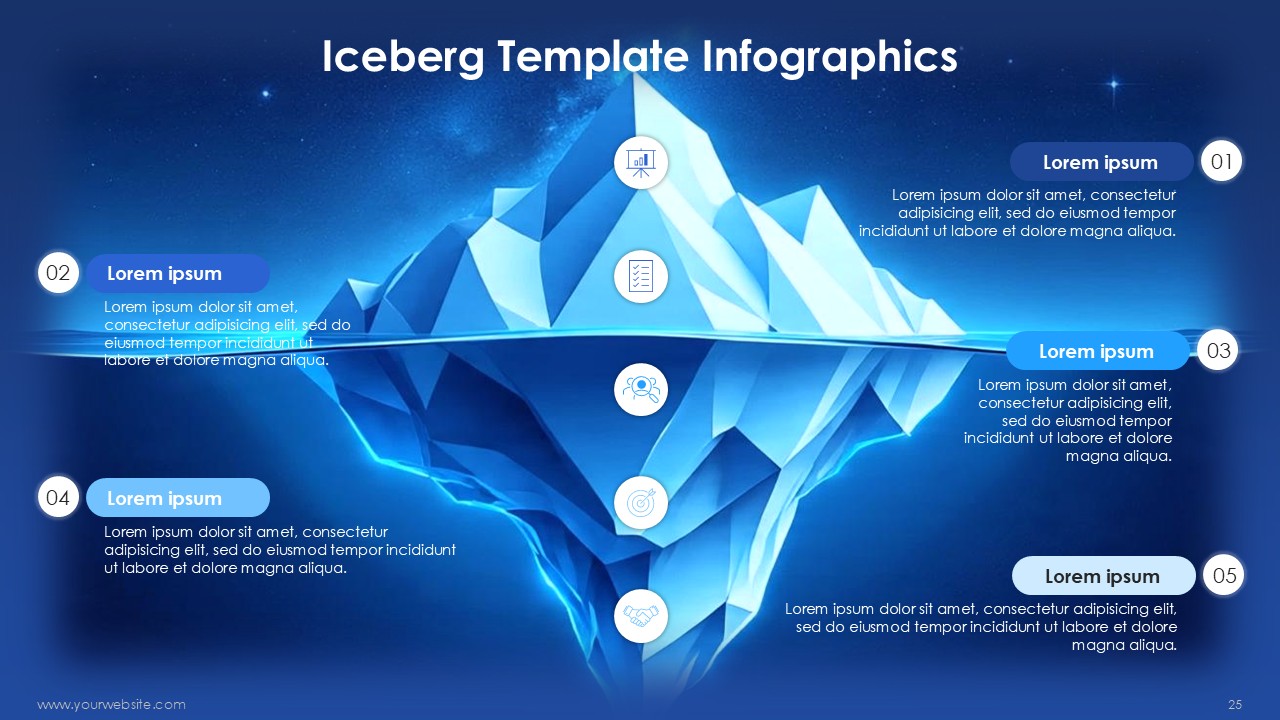
The Iceberg Template Infographics PowerPoint Template features 26 expertly crafted slides that will help you depict layered ideas in visually striking narratives. Entirely cloaked in a spectrum of analytical blues—from shallow aqua to abyssal navy—this template uses the underlying iceberg metaphor to reveal hidden truths. It serves the purposes of an analyst, a strategist or an educator as they can turn abstract surfaces of data into visually captivating stories.
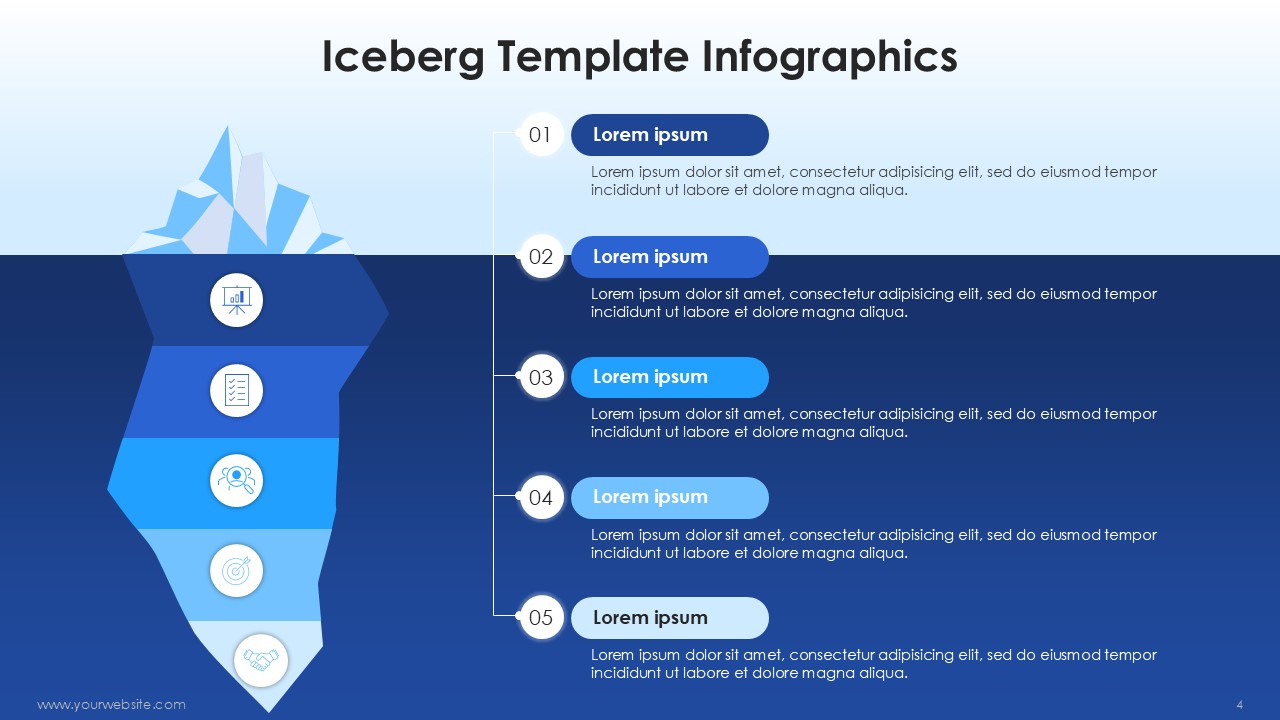
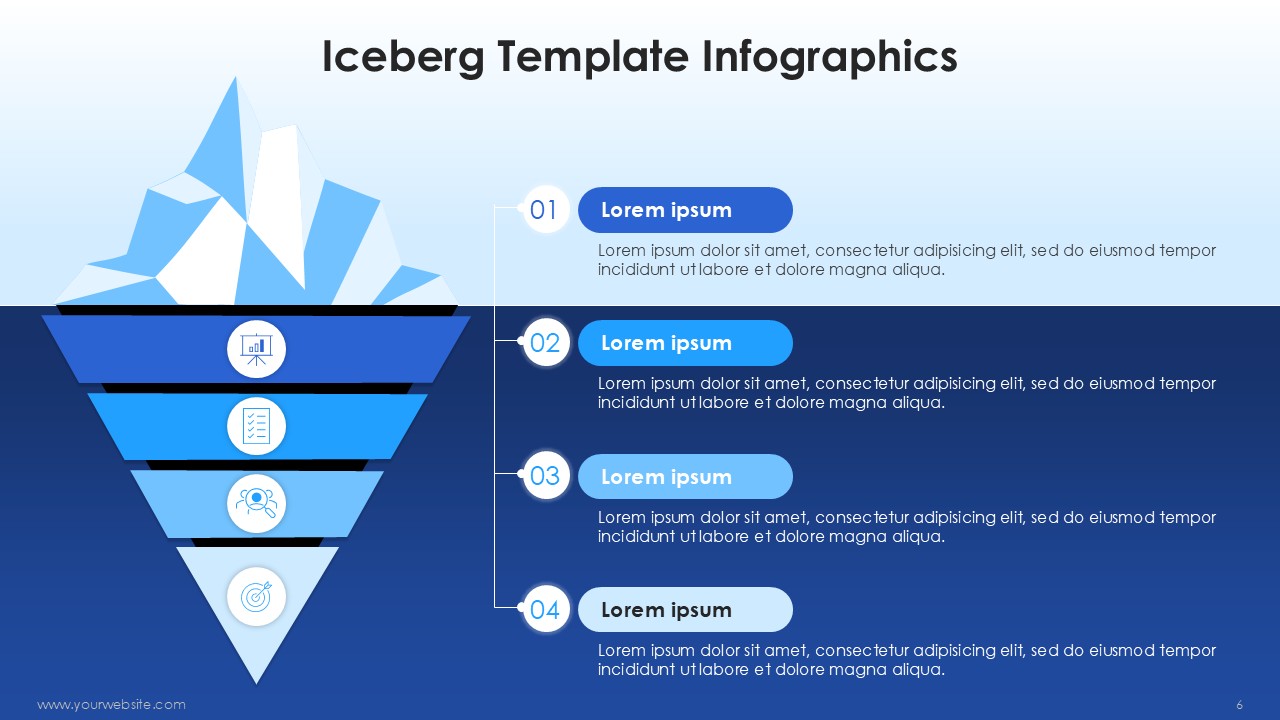
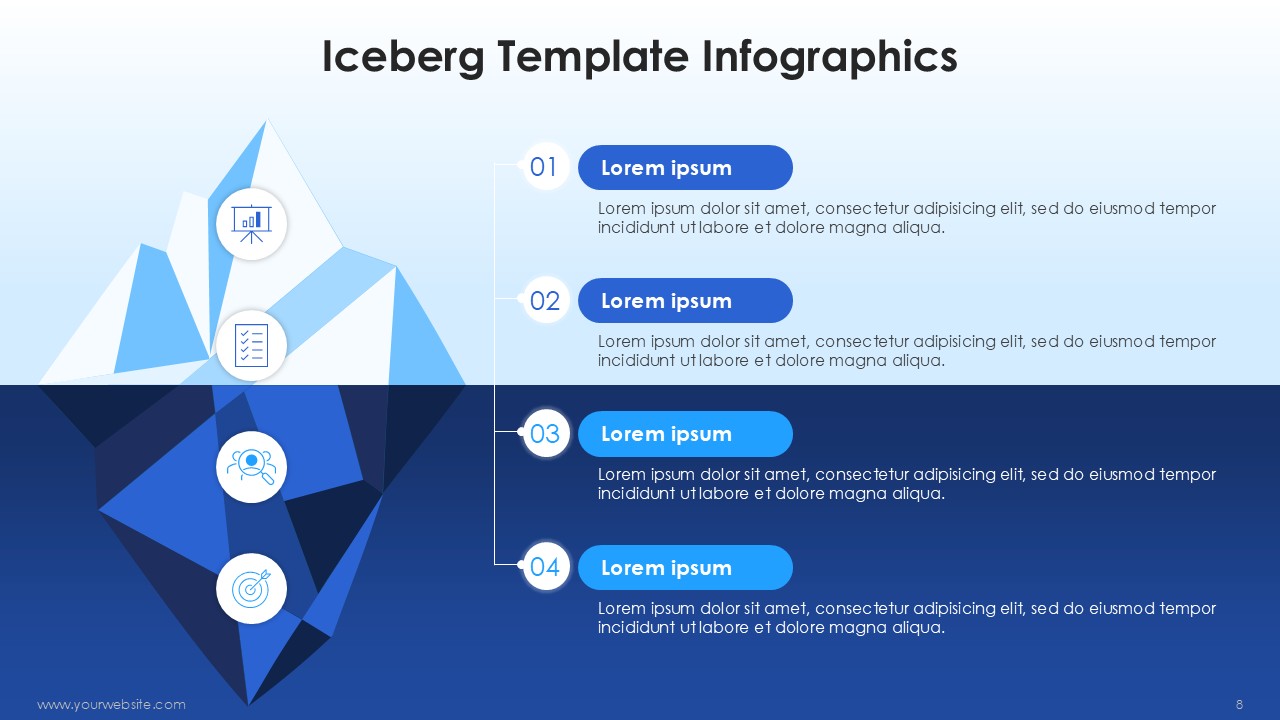
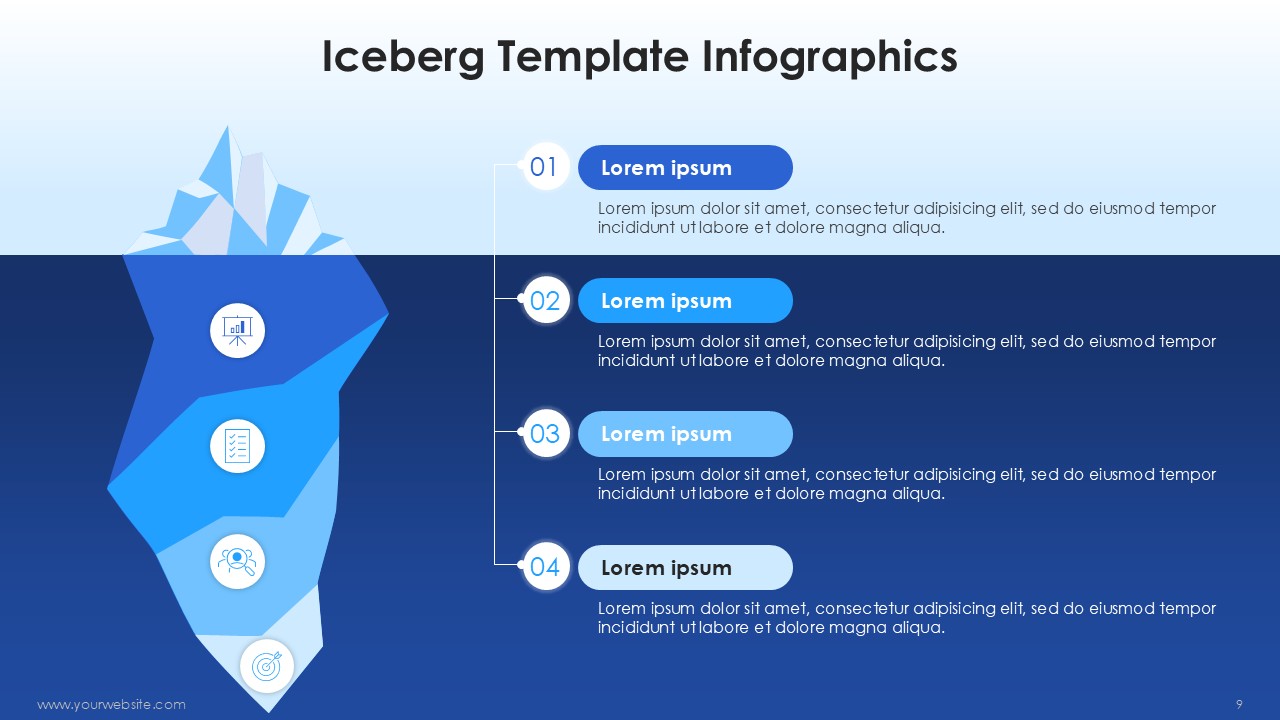
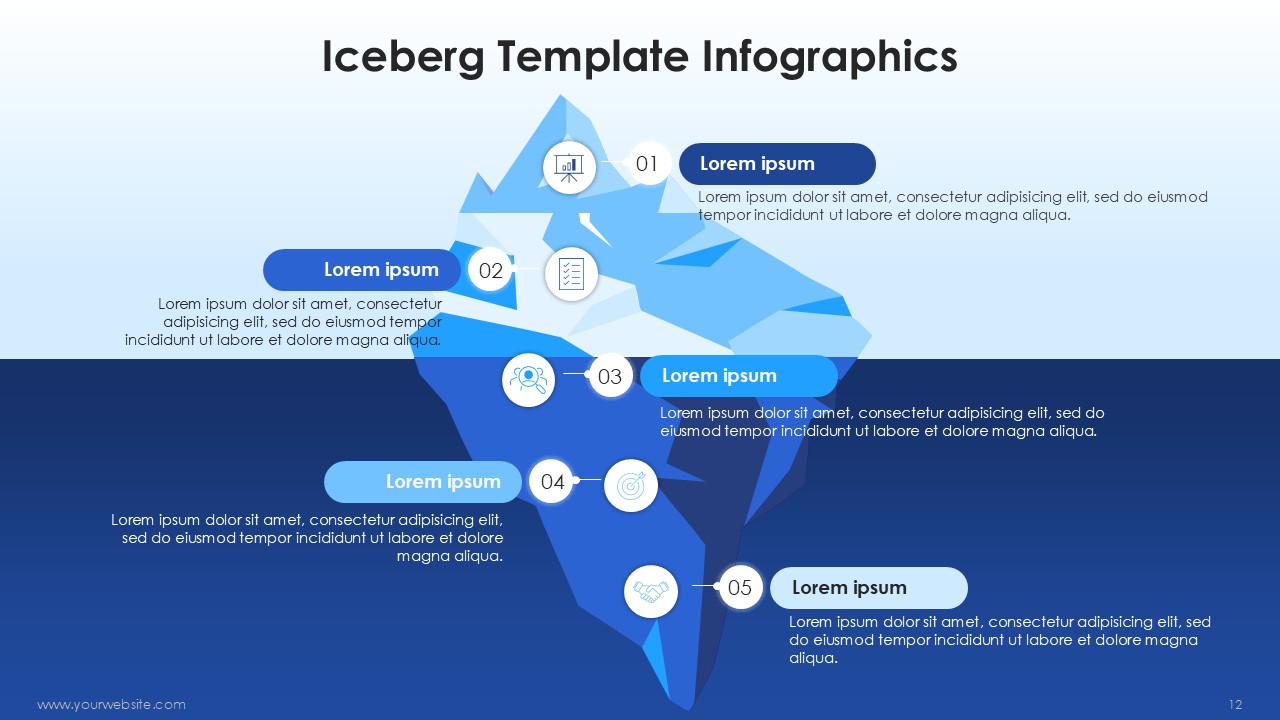
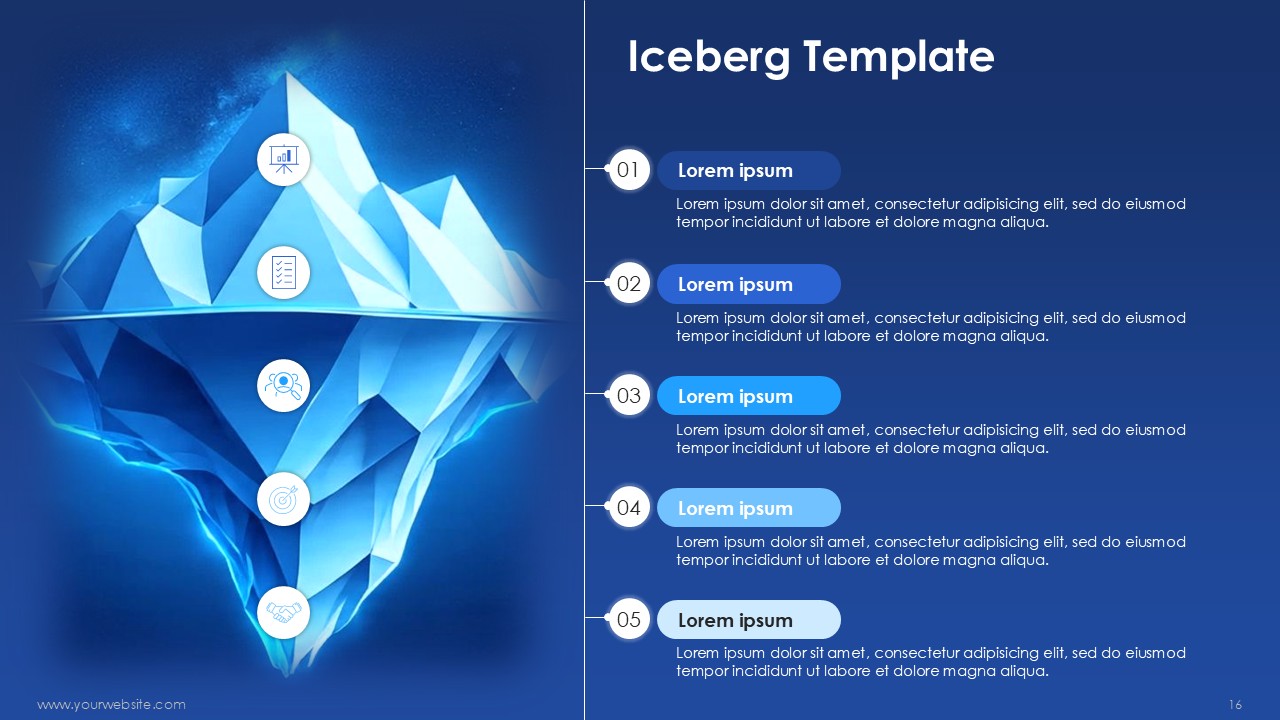
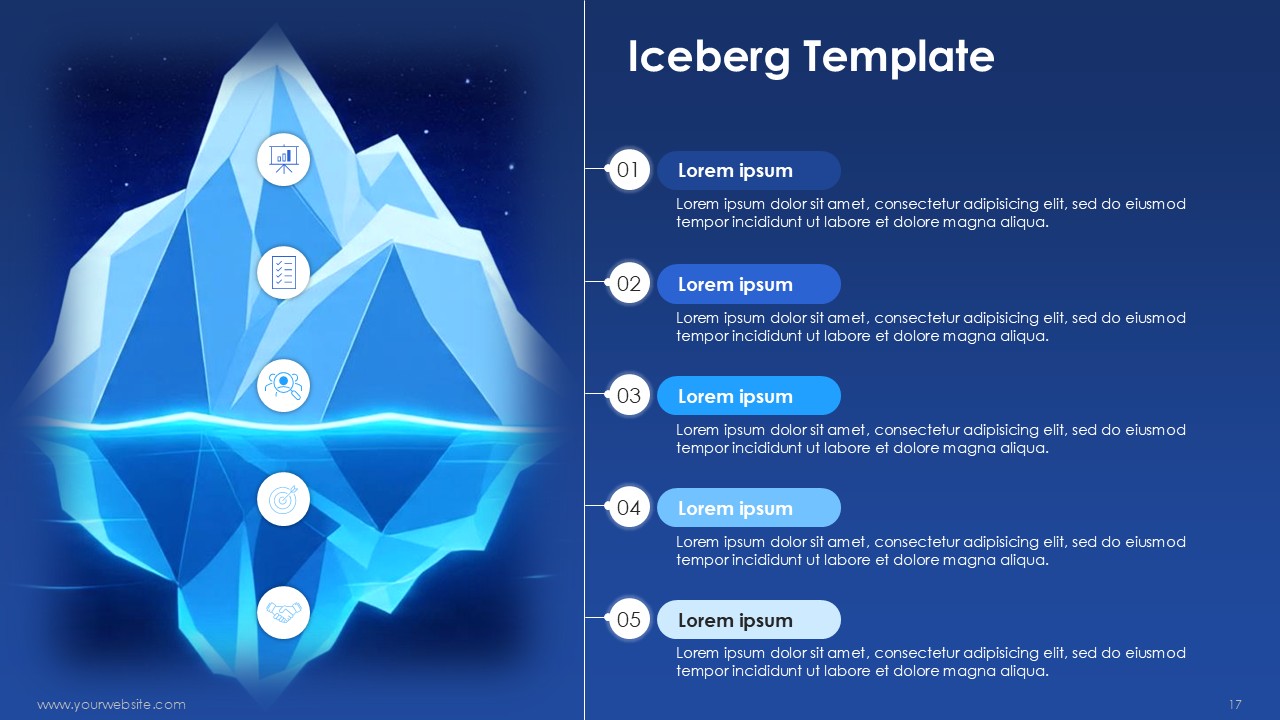
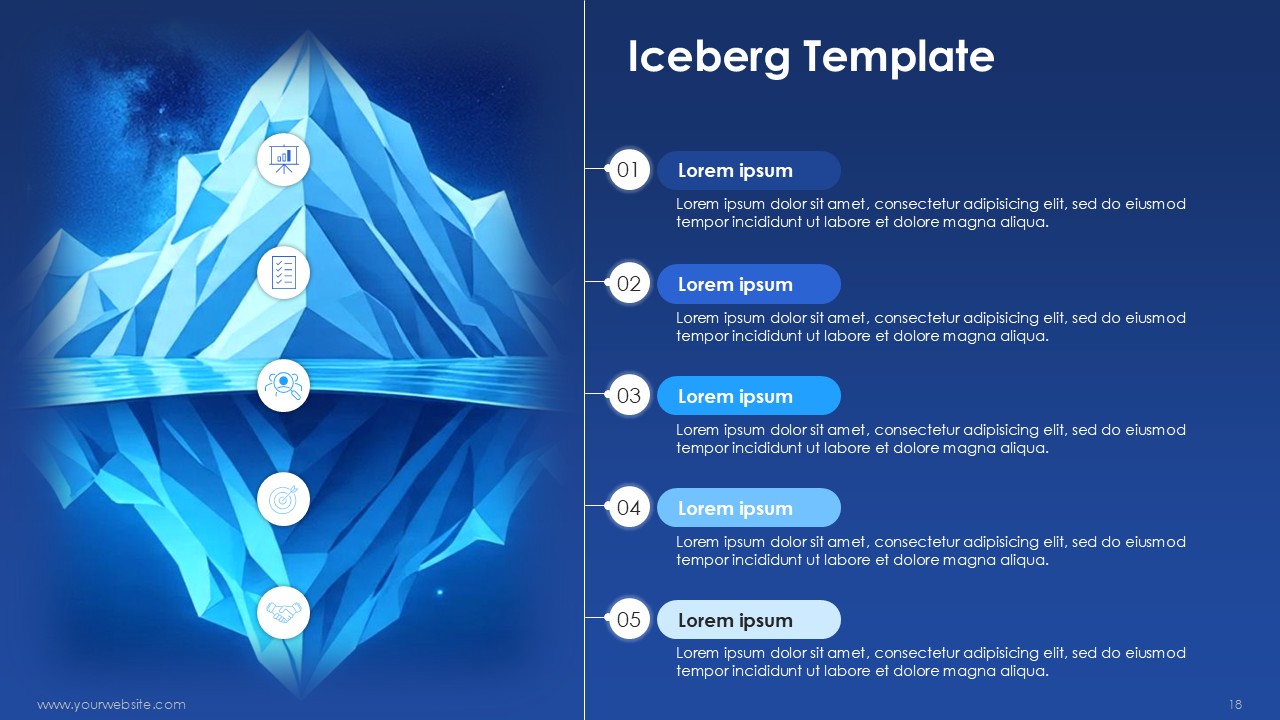
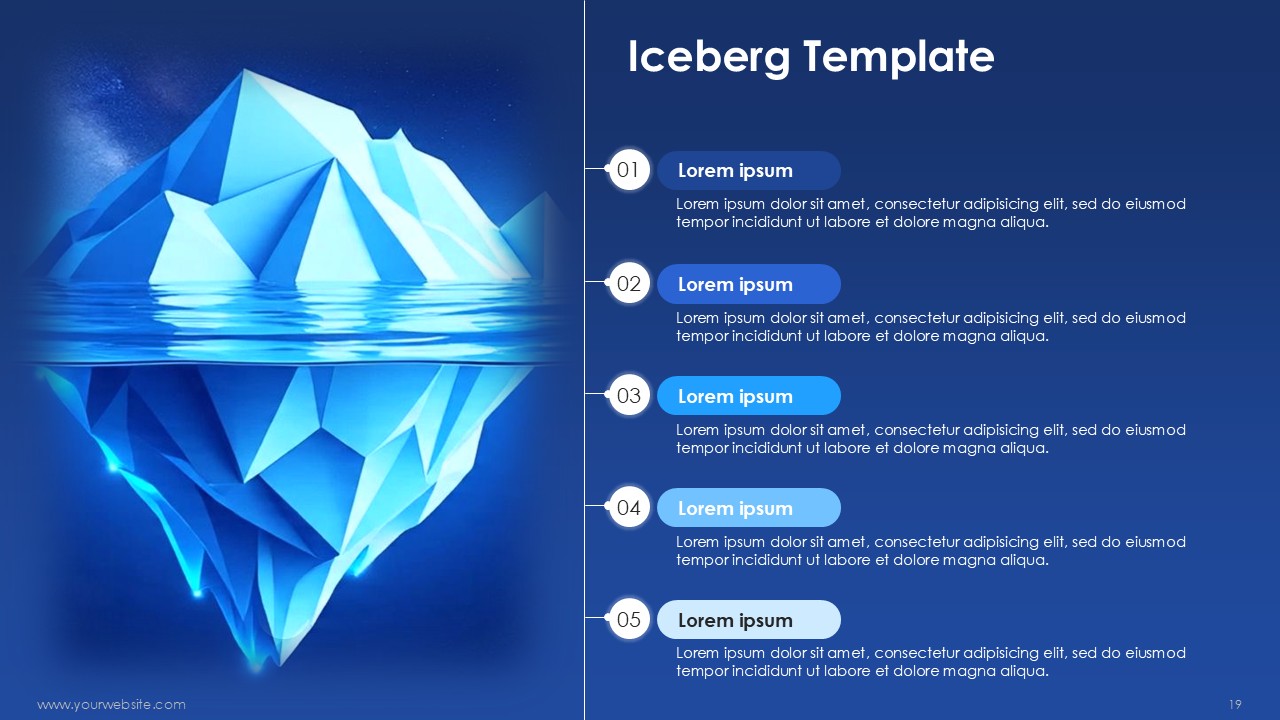
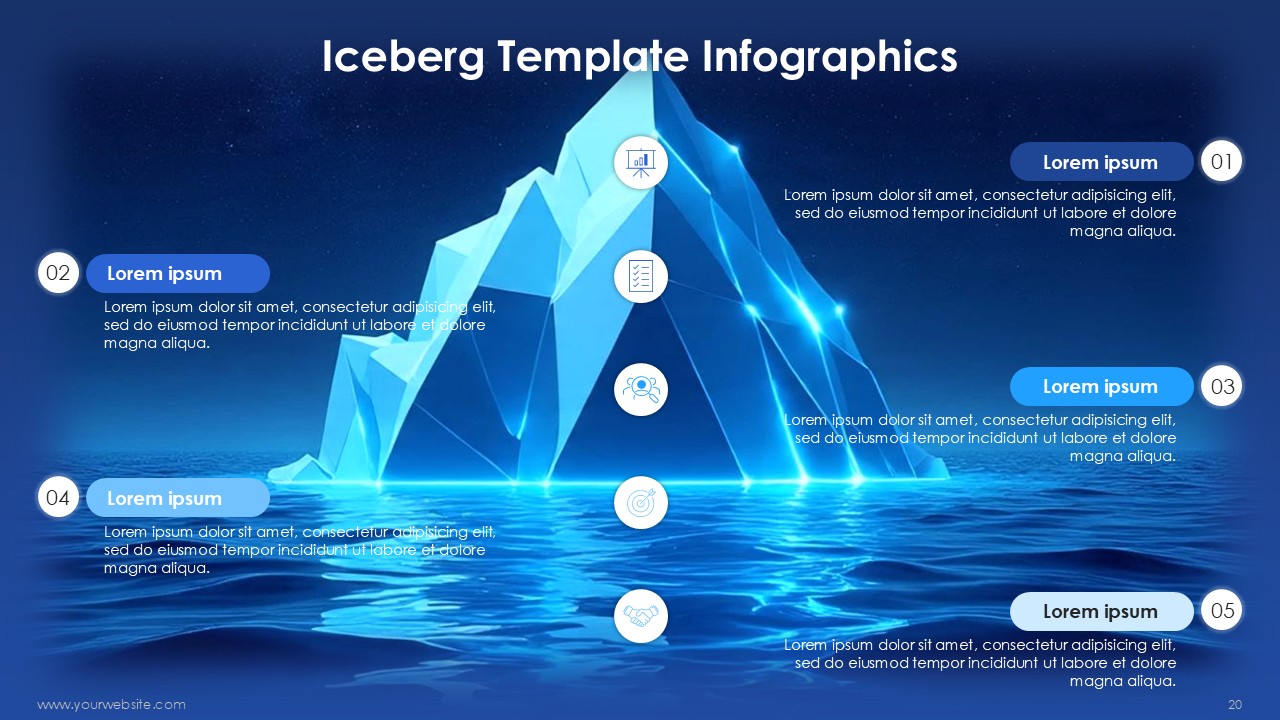
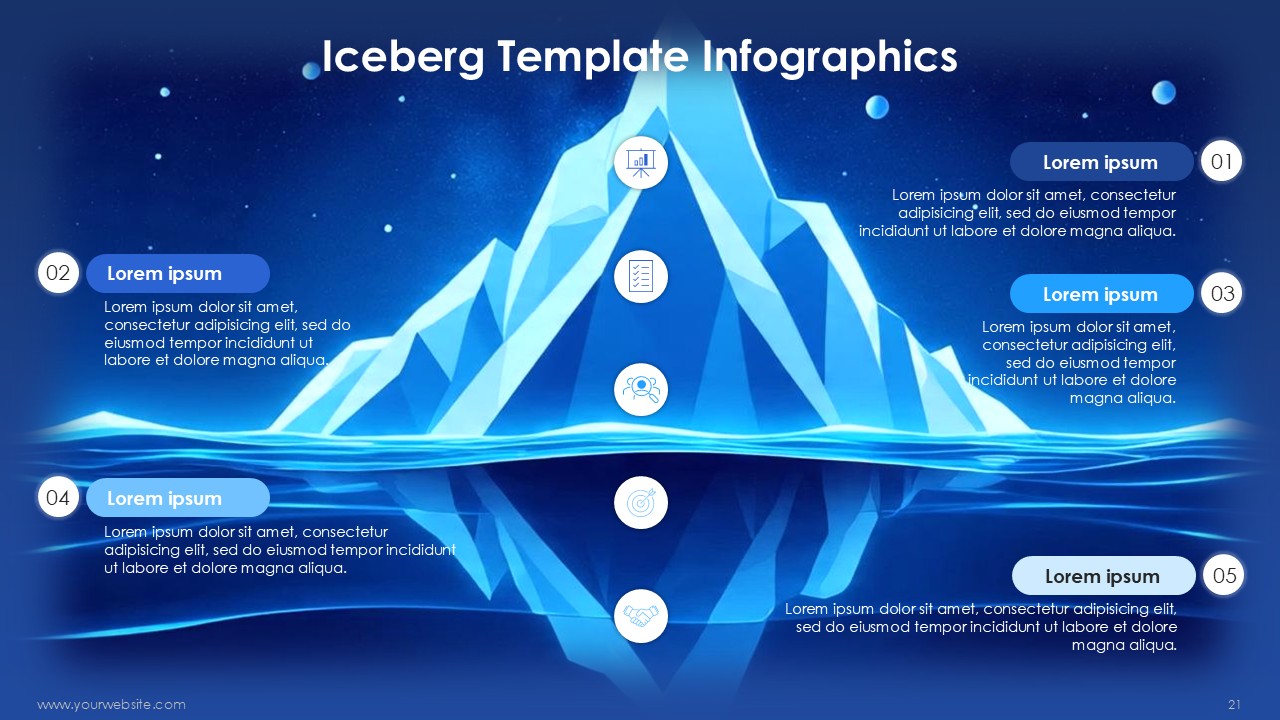
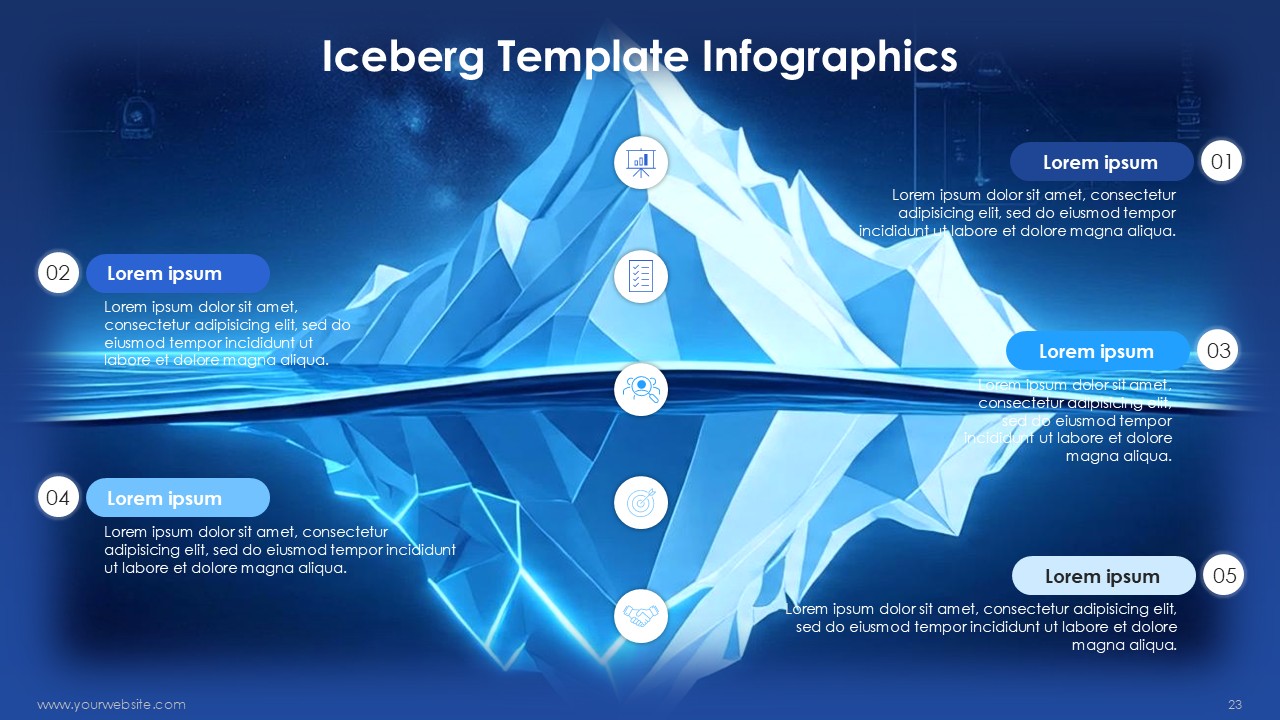
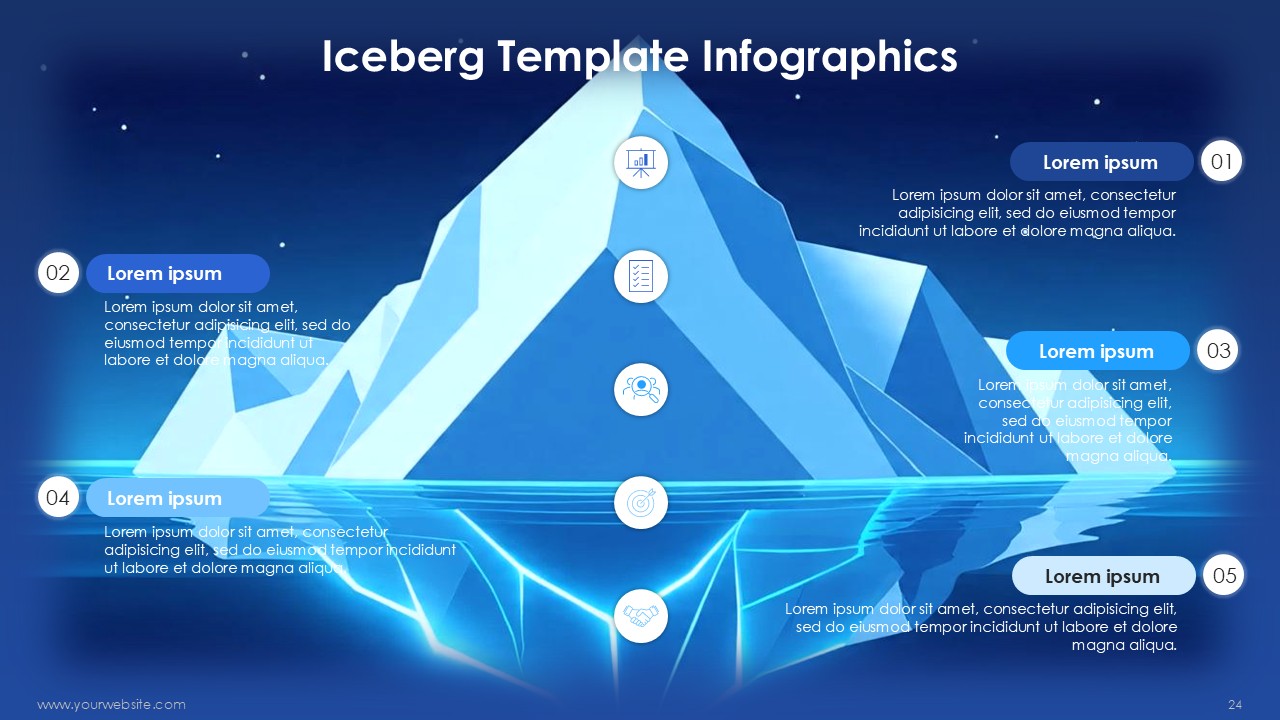
The Iceberg Template Infographics PowerPoint Template uses and abuses visual psychology for the purpose of analyzing multi-layered systems. Each slide features “tip” graphics that show observations or to provide glimpse into the data, while submerged portions reveal hidden causes, hidden risks, or systemic roots. Expect crisis breakdowns distinguishing structural failure causes from escalated symptoms, market analyses juxtaposing consumer actions and cultural drivers, and even organizational graphs unveiling the informal power structures underlying the formal hierarchy, all rendered hydrodynamically sharp.
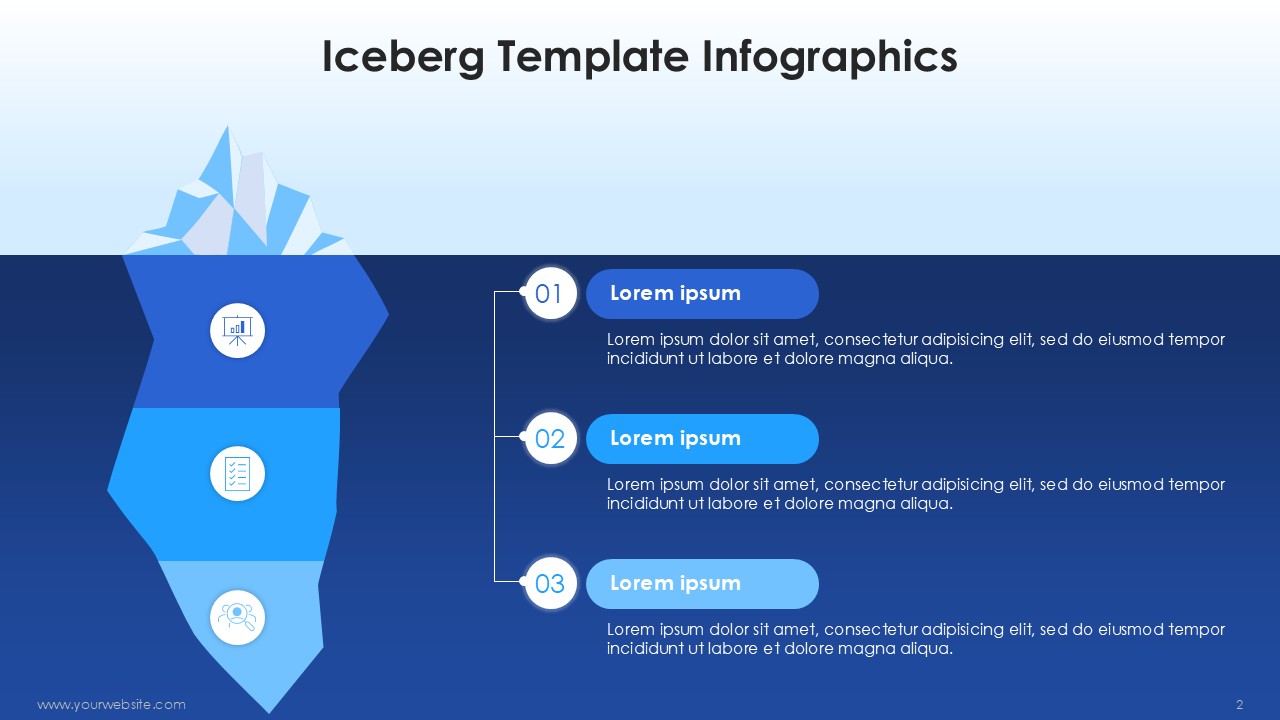
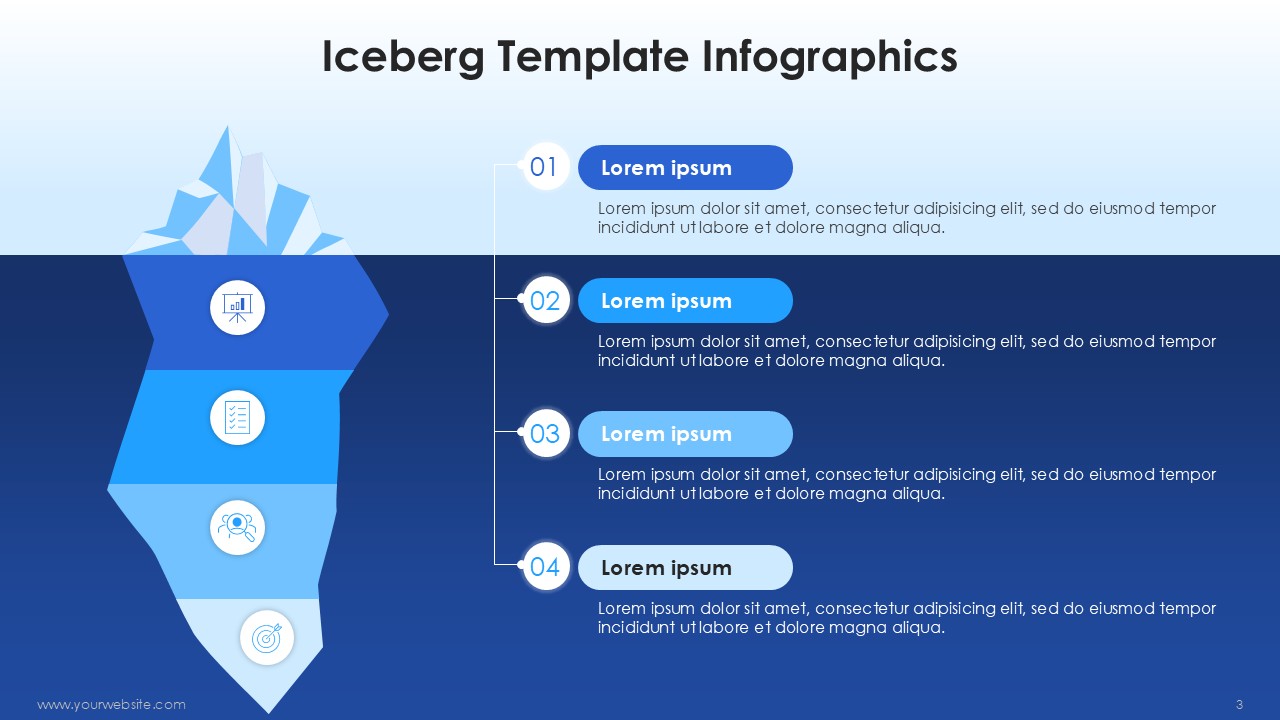
Associate shallow waters with accessible data, mid-depths with operational levels, navy trenches with core truths. With the template, lighter blues can emphasize surface metrics while positioning transitional teals as mid-systems and dark blues as fundamental realities. The Iceberg Infographics PowerPoint Template uses this system to provide an effortless and pressure-like way for the audience to go from visible symptoms of a problem to the intuitive, submerged resolutions.
Marketers, therapists, and economists can use this template to visualize and uncover covert market and behavioral influences. This template is perfect for cultural audits, strategic planning sessions, and educational workshops focused on distinguishing systems and symptoms.
True mastery resides beneath the surface, and the template unlocks profound insights alongside sharpened perceptual acuity for stakeholders, empowering them to navigate through layers beyond the visible. Download the Iceberg Template Infographics PowerPoint Template now and start to transform superficial understandings alongside leveraging uncover latent insights for in-depth analysis.
SlidesBrain offers presentation features that allow you to customize every aspect of your slides. This means you can modify text, images, colors, fonts, and icons to your liking. Additionally, adjusting graphs in PowerPoint is simple, enabling you to change colors, numbers, and labels to match your preferences and create the perfect presentation.
“A review from a customer who benefited from your product. Reviews can be a highly effective way of establishing credibility and increasing your company's reputation.”
★★★★★Rated 5 out of 5
“A review from a customer who benefited from your product. Reviews can be a highly effective way of establishing credibility and increasing your company's reputation.”


 MS Powerpoint