Environmental scanning Infographics PowerPoint Template
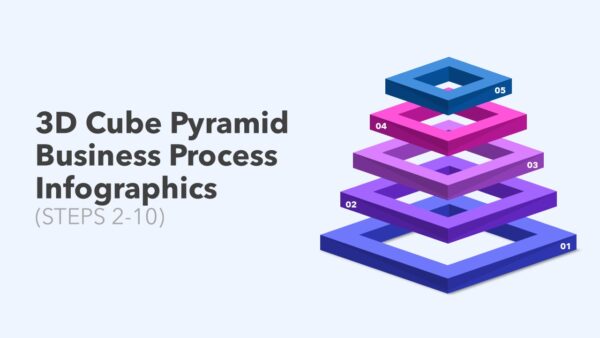
The Environmental Scanning Infographics PowerPoint Template bundles fourteen carefully crafted slides for anyone charged with showing sustainability numbers, ecological patterns, or corporate ESG initiatives in clear, engaging ways. Its fresh palette of green, blue, and cyan evokes the colour palette of a healthy ecosystem while still looking polished enough for the boardroom. Whether you are reading aloud a climate update, leading a sustainability workshop, or briefing policymakers, the design turns raw environmental figures into narratives that draw people in.
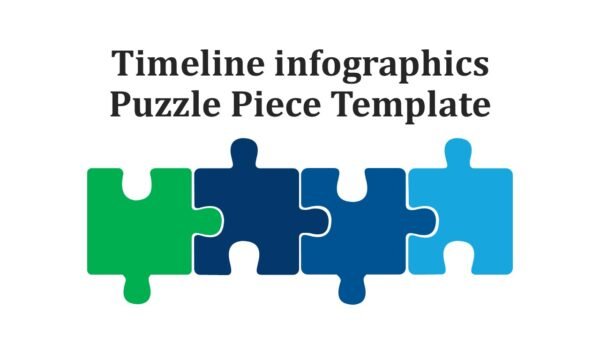
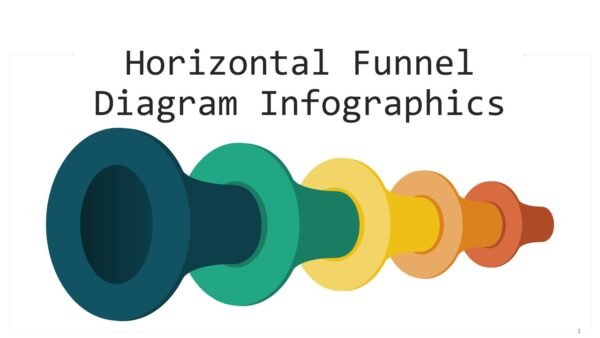
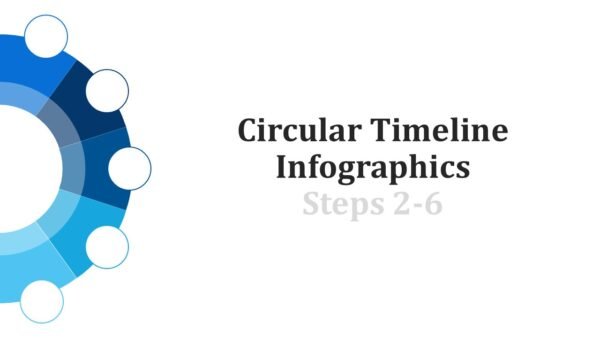
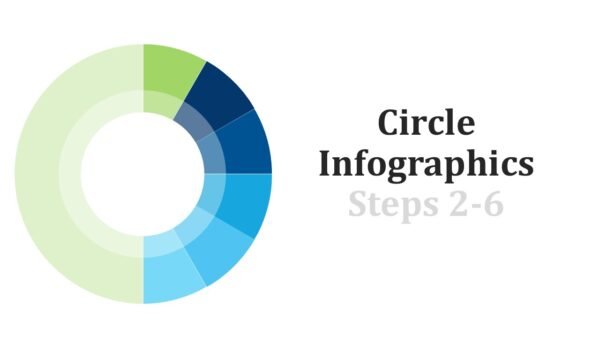
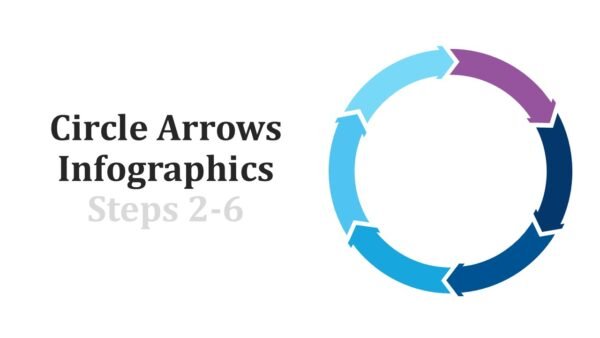
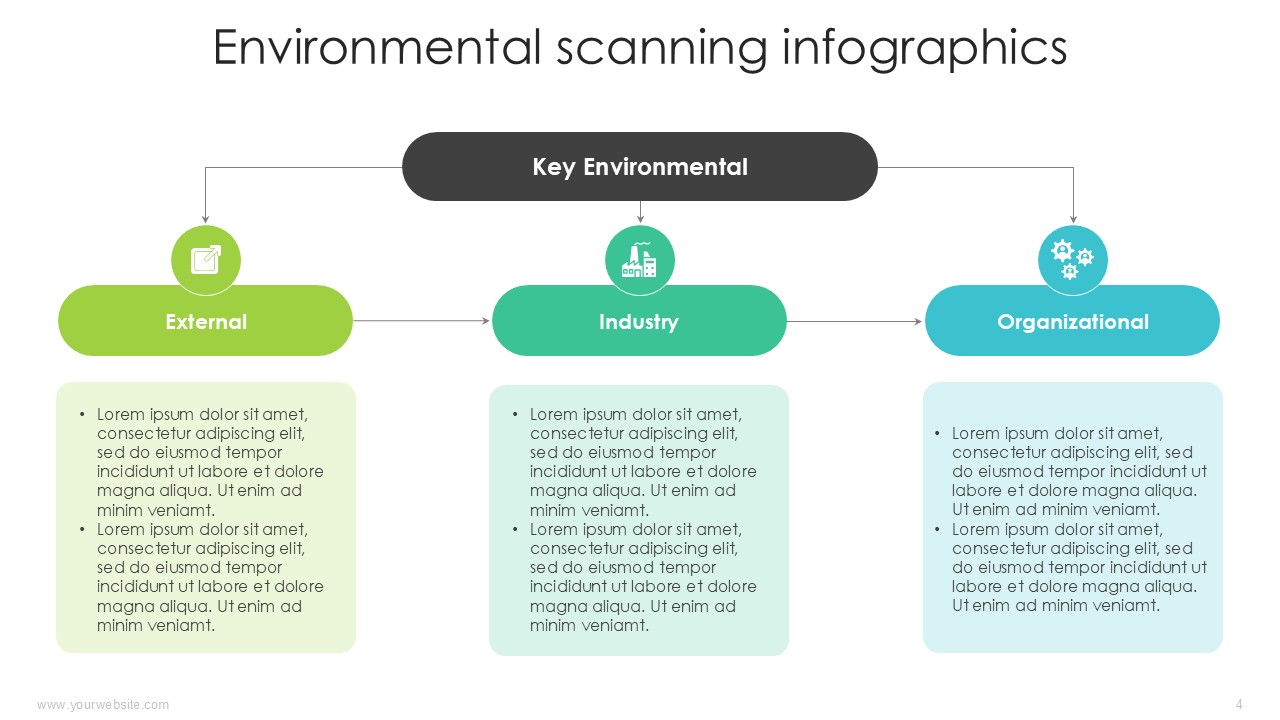
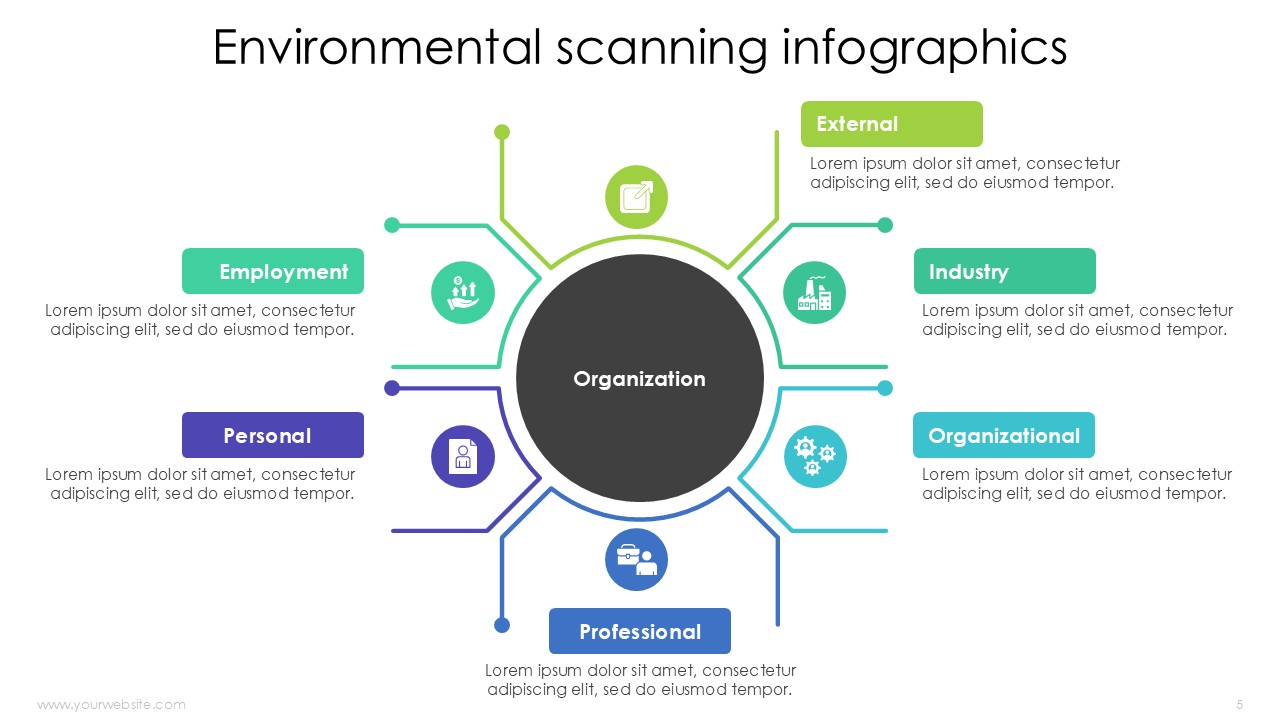
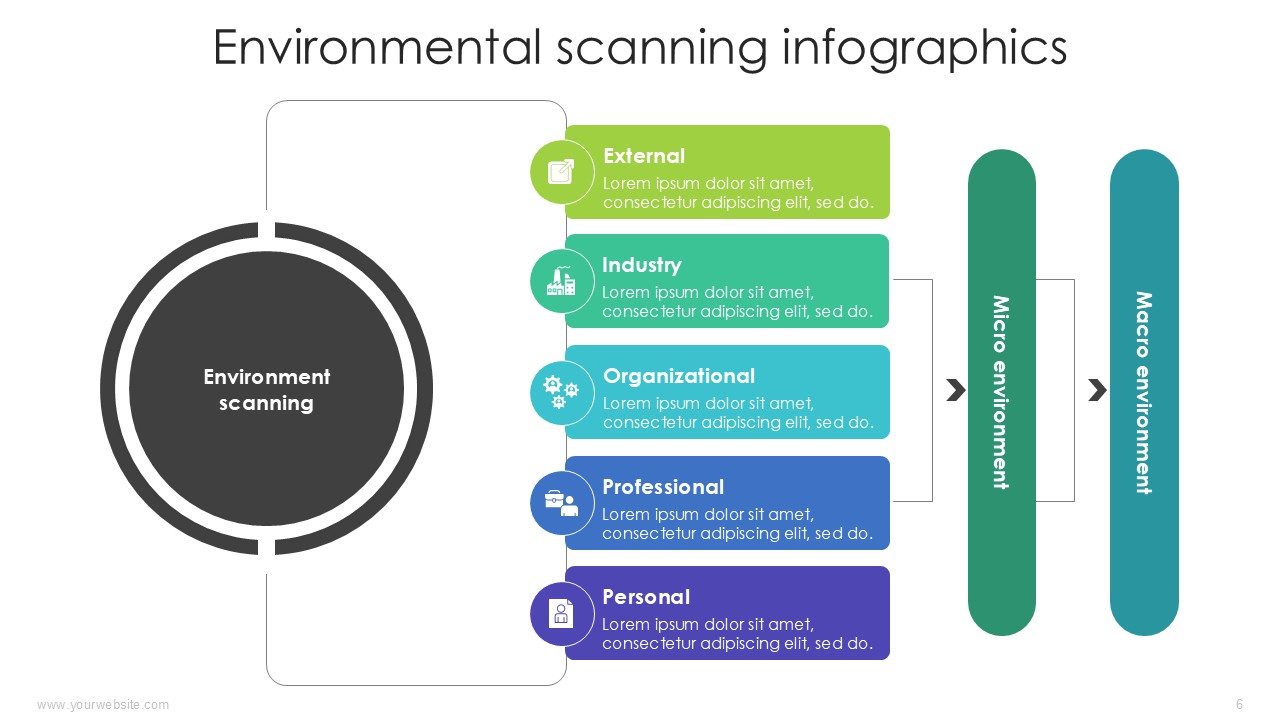
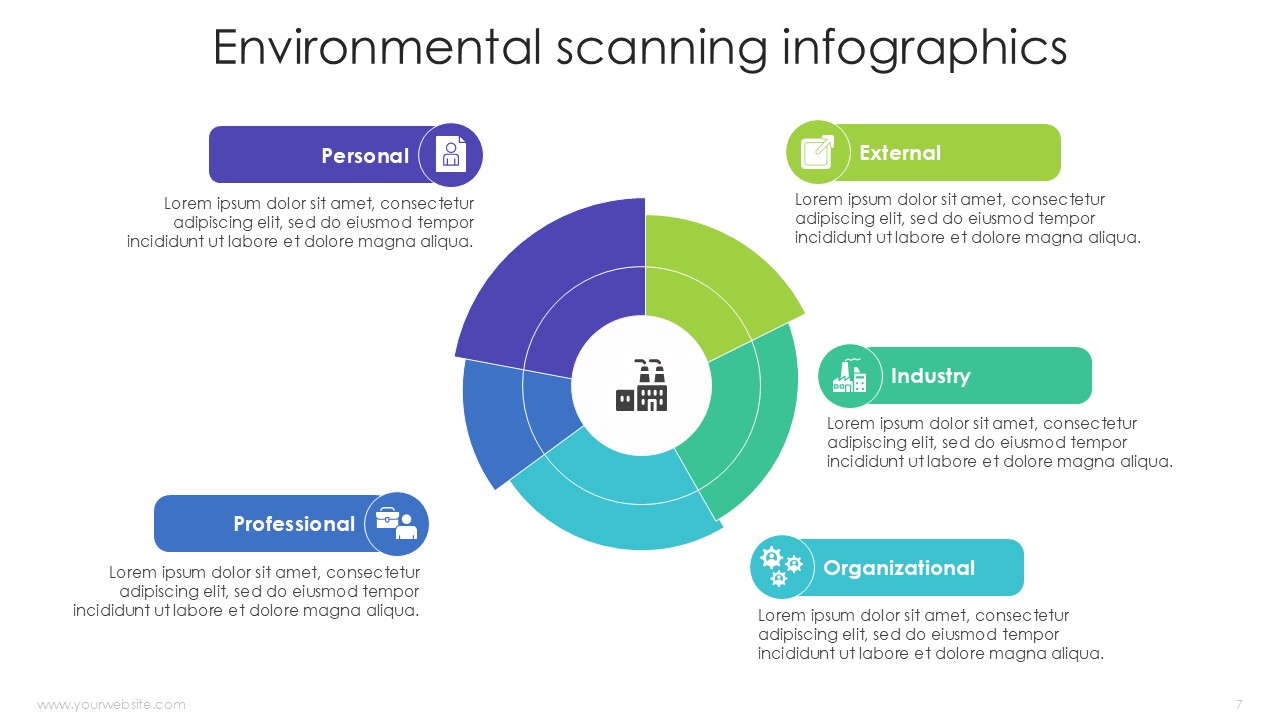
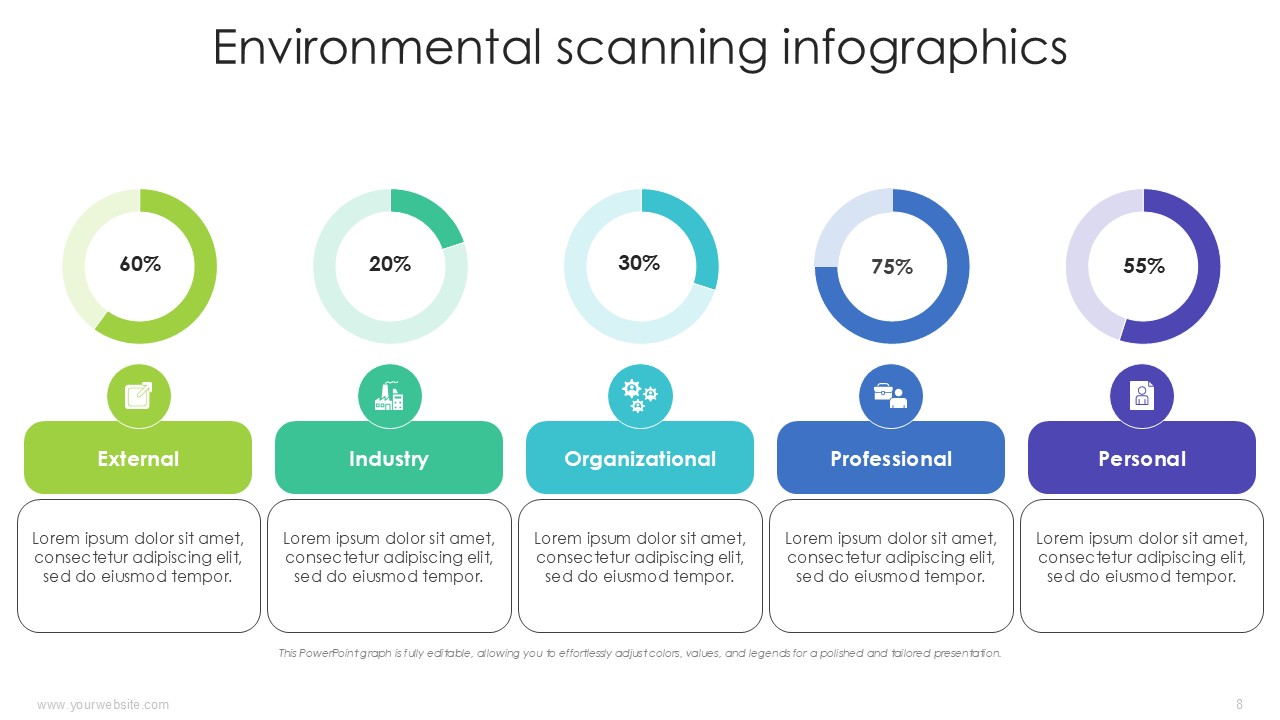
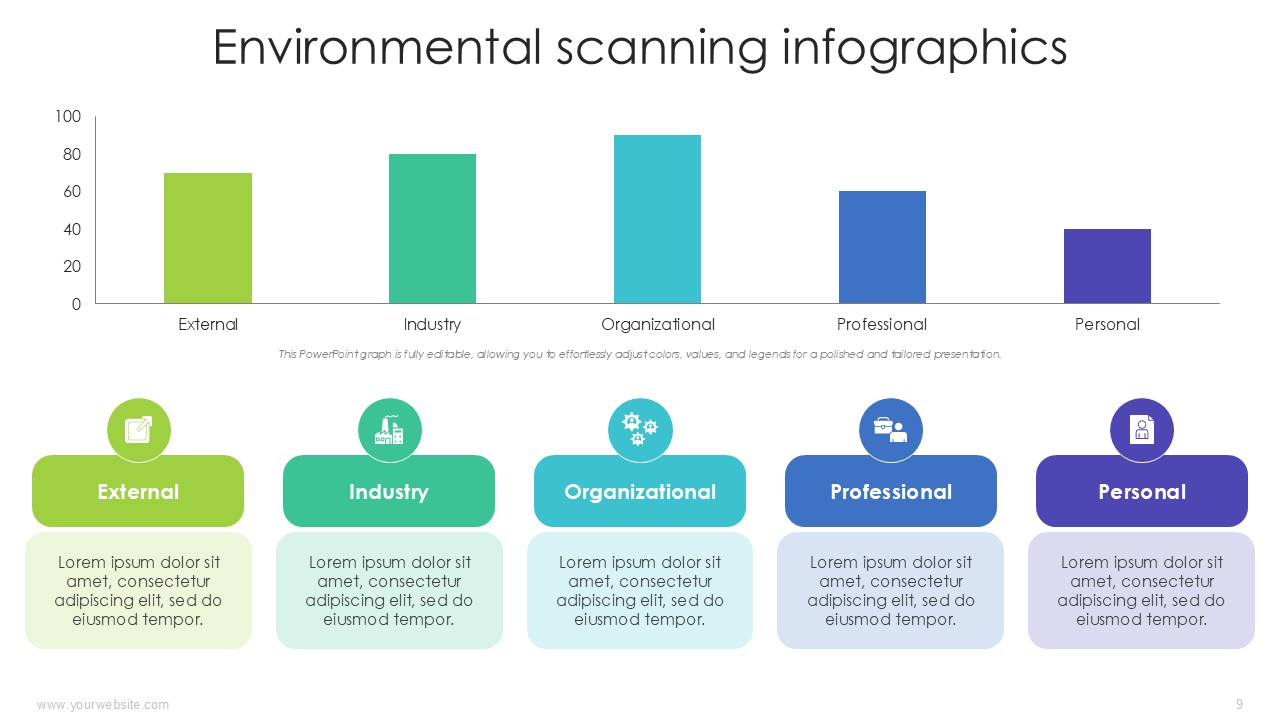
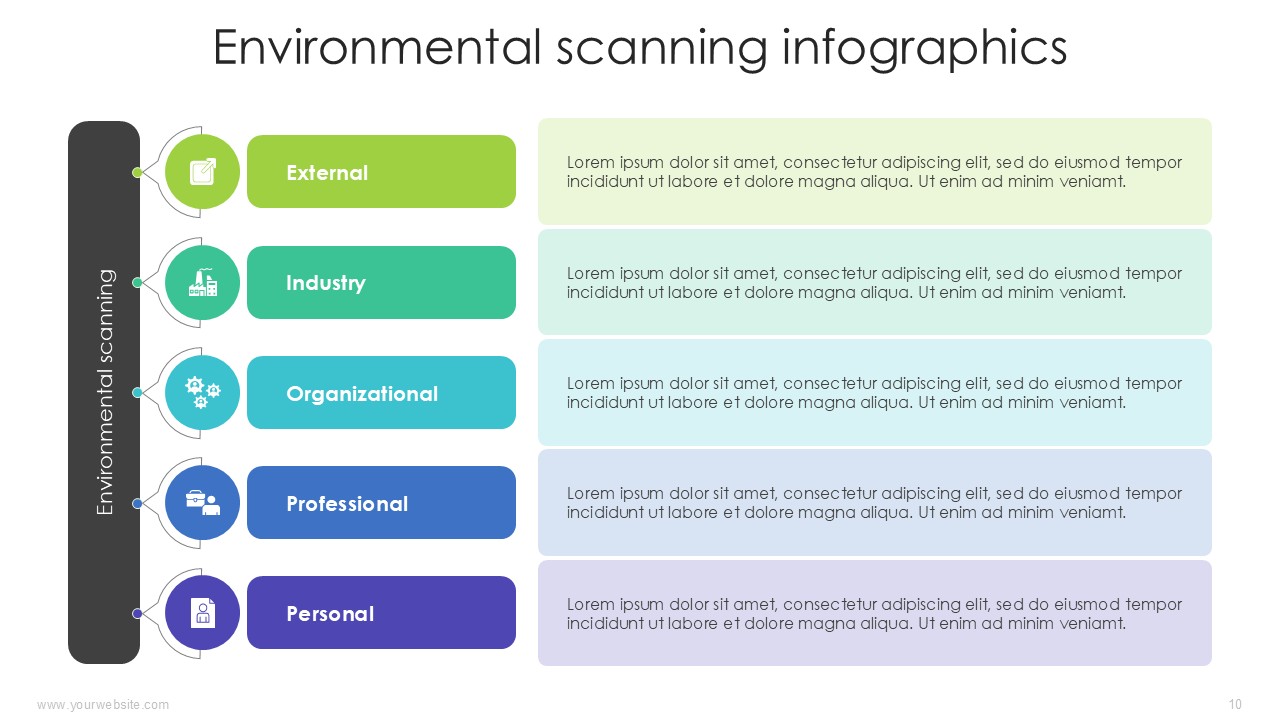
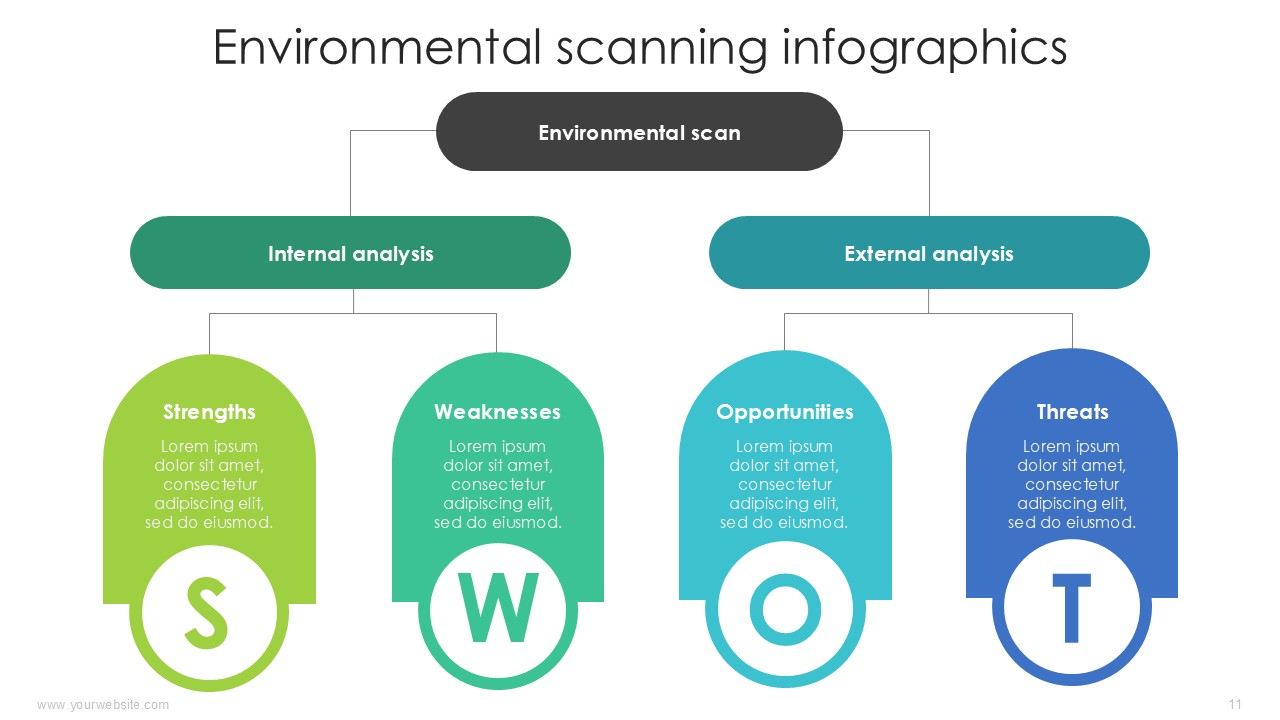
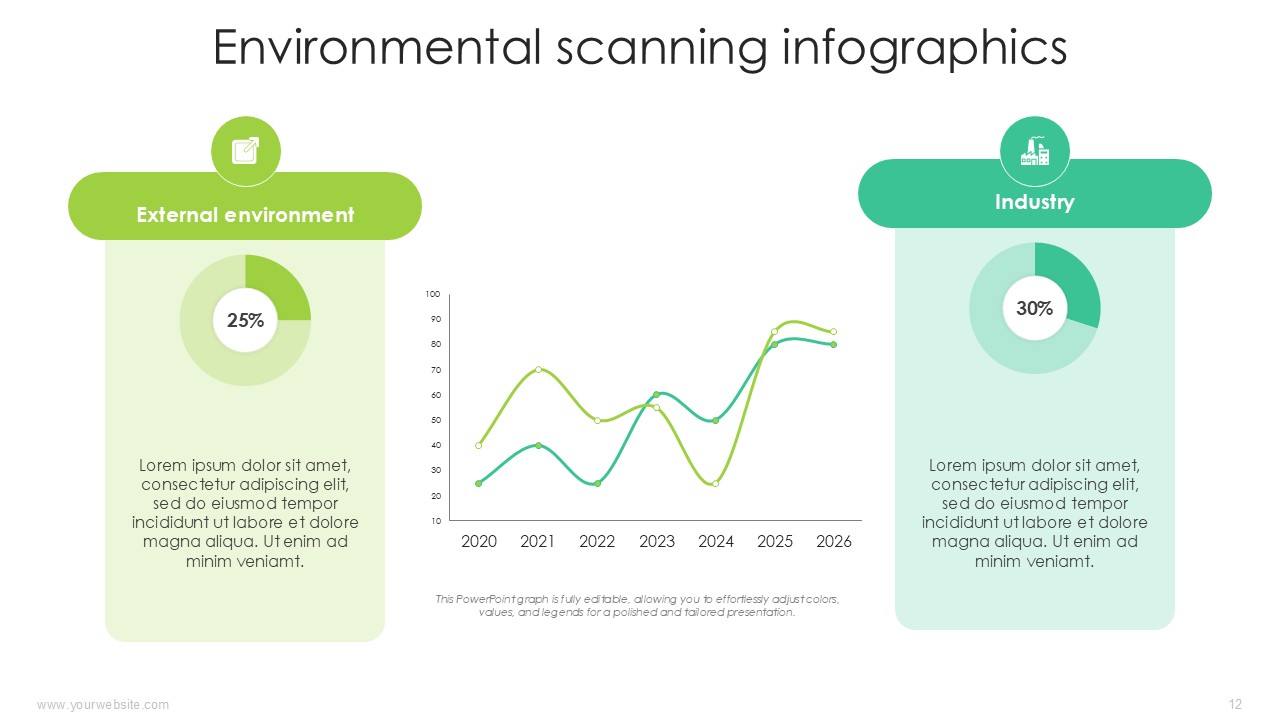
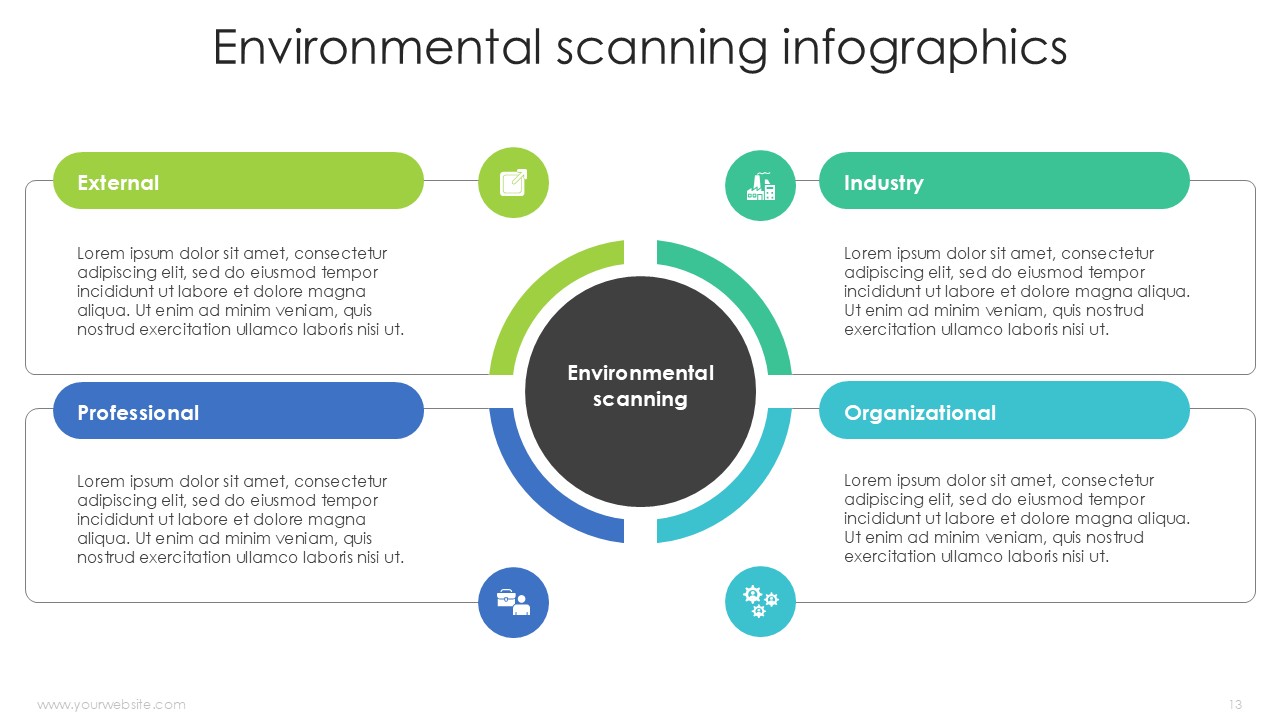
Inside the set you will find carbon-footprint spark lines, timeline visuals for biodiversity losses, circular-economy wheels, and side-by-side mix charts comparing renewable energies. The package also includes custom slots for SWOT reviews of ecological drivers, PESTLE grids that track green moves, and snapshot dashboards that mirror SDG programme progress. Because each diagram fuses scientific rigour with a public-friendly style, even the most complex sustainability ideas stay accessible to every stakeholder in the room.
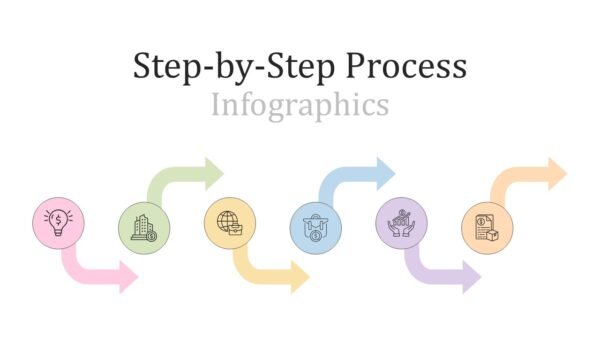
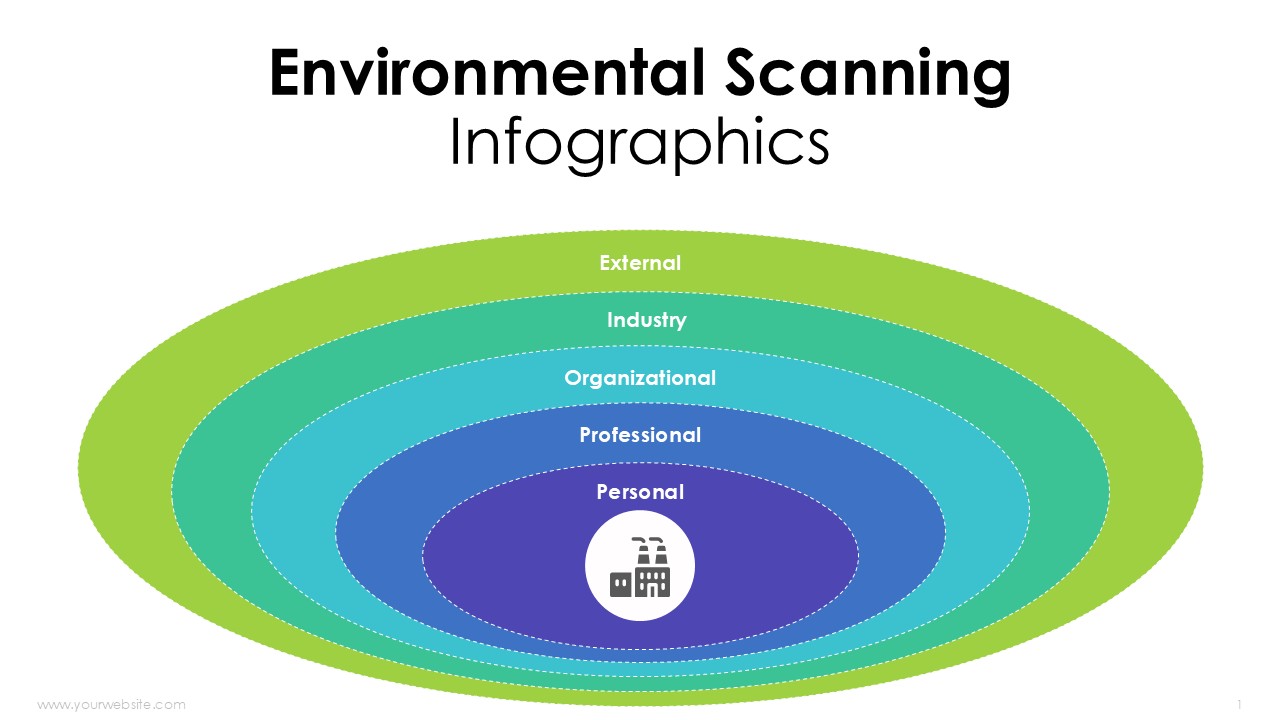
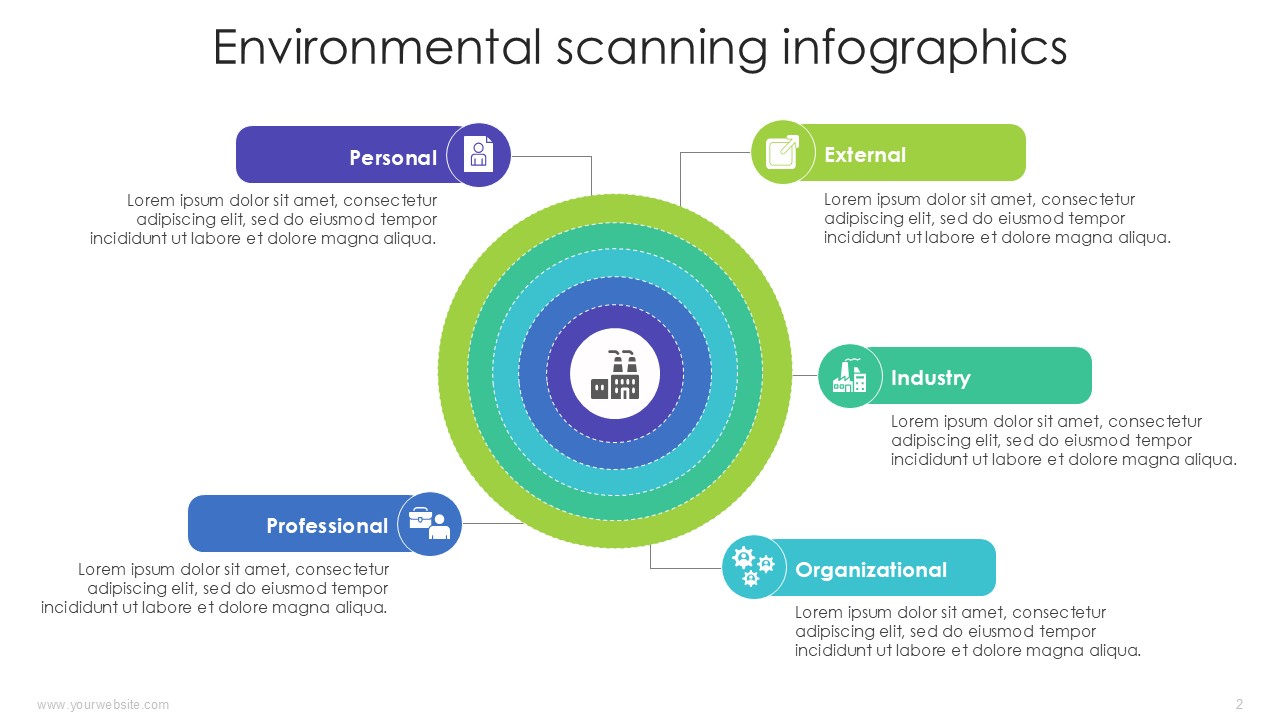
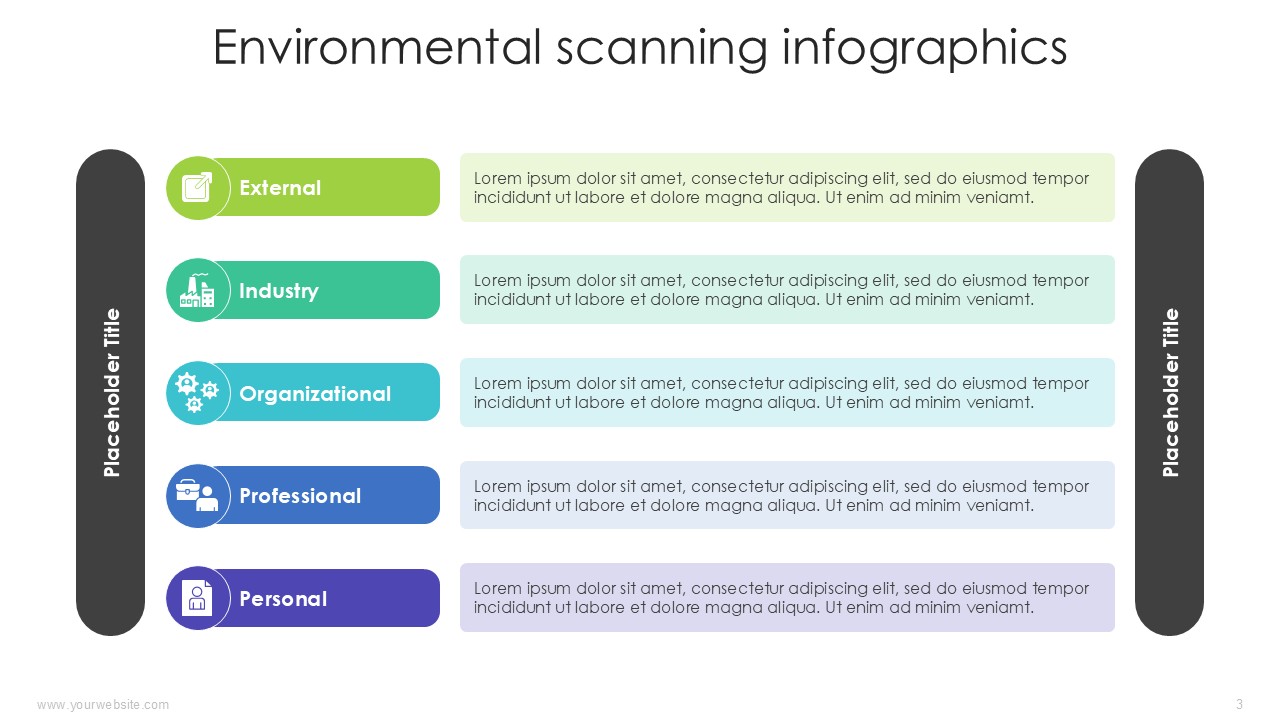
Psychologically tuned colours-green for growth, blue for trust, cyan for innovationpowerfully boost memory when stakes are high. Flow-guided layouts lead audiences through cause-and-effect sequences in climate, through step-wise roadmaps for action, and from before-to-after views for conservation wins. When executives, community groups, or campus panels watch the slides, the template helps make insight stick and convert words into concrete next steps.
Thanks to fully editable vector graphics in both PowerPoint and Google Slides, the Environmental Scanning Infographics Template trims design time by roughly seventy percent versus creating slides from scratch. You drag-and-drop your figures, match color accents to your brand palette, and use smart placeholder text for speedy revisions. Because the layout follows data-visualization best practices, every chart automatically complies with accessibility guidelines.
Ideal for corporate sustainability officers preparing annual ESG reports, government agencies illustrating climate-policy effects, NGOs showcasing conservation-program results, educators teaching environmental-science concepts, and consultants pitching green-transformation strategies. Elevate your next sustainability brief from routine to remarkable. Download the template today and turn each data point into a catalyst for meaningful change.
Template Specifications
Name: | Environmental scanning Infographics PowerPoint Template |
Quantity: | 14 slides |
Ratio: | 16:9 |
Colors : | |
Rating: | Premium |
Tutorials: | Click Here to View More |
SlidesBrain offers presentation features that allow you to customize every aspect of your slides. This means you can modify text, images, colors, fonts, and icons to your liking. Additionally, adjusting graphs in PowerPoint is simple, enabling you to change colors, numbers, and labels to match your preferences and create the perfect presentation.
Looking for a slide or PPT that’s uniquely yours? Our presentation design agency is here to help make your ideas a reality. As a leading presentation design company, we focus on delivering premium-grade bespoke presentations that engage your audience and ensure message retention. Kindly get in touch with us for professional custom presentation design services and transform your brand’s message for the purpose that you have in mind.
Premium Template
Unlock this template and gain unlimited access
Template Specifications
Dimensions
15 Slides, 1366 x 768 pixels – 16:9 Aspect Ratio (HD Presentation Quality)
Format
Download as a PPT to share with your recipient or generate a shareable link for online sharing.
Customizable
This template can be fully customized. You can edit content, change image(s), apply custom colors, input your own fonts and logo, and more.
Related tags
Related Presentations
No related products found.
-
blue
Environmental scanning Infographics PowerPoint Template
Rated 0 out of 5business | 14 slides 16:9 -
blue
Cryptocurrency and Blockchain Innovations Steps 3 to 10 PowerPoint Infographics
Rated 0 out of 5Infographics | 7 slides 16:9 -
blue
Blockchain and Cryptocurrency Steps 4 to 8 PowerPoint Infographics
Rated 0 out of 5Infographics | 7 slides 16:9 -
blue
Big Data Analytics Steps 4 to 8 PowerPoint Infographics
Rated 0 out of 5Infographics | 7 slides 16:9
Related products
-
blue
The 10 Minute Startup Pitch One Pager Presentation Deck
Rated 0 out of 5Business | 1 slides 16:9 -
blue
Social Media Strategy One Pager Editable PPT Template
Rated 0 out of 5marketing | 1 slides 16:9
Customer Reviews
“A review from a customer who benefited from your product. Reviews can be a highly effective way of establishing credibility and increasing your company's reputation.”
Customer Name
“A review from a customer who benefited from your product. Reviews can be a highly effective way of establishing credibility and increasing your company's reputation.”
Customer Name