Circular Cycle Diagram Steps 5 Infographics PPT Template
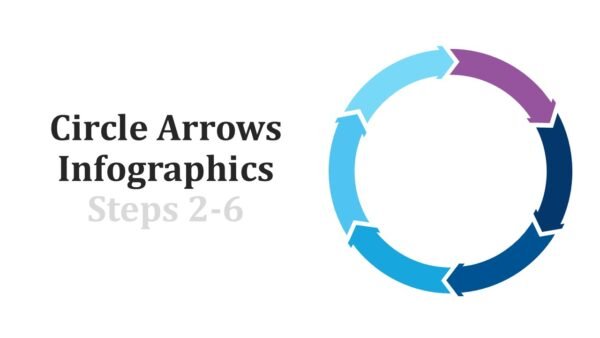
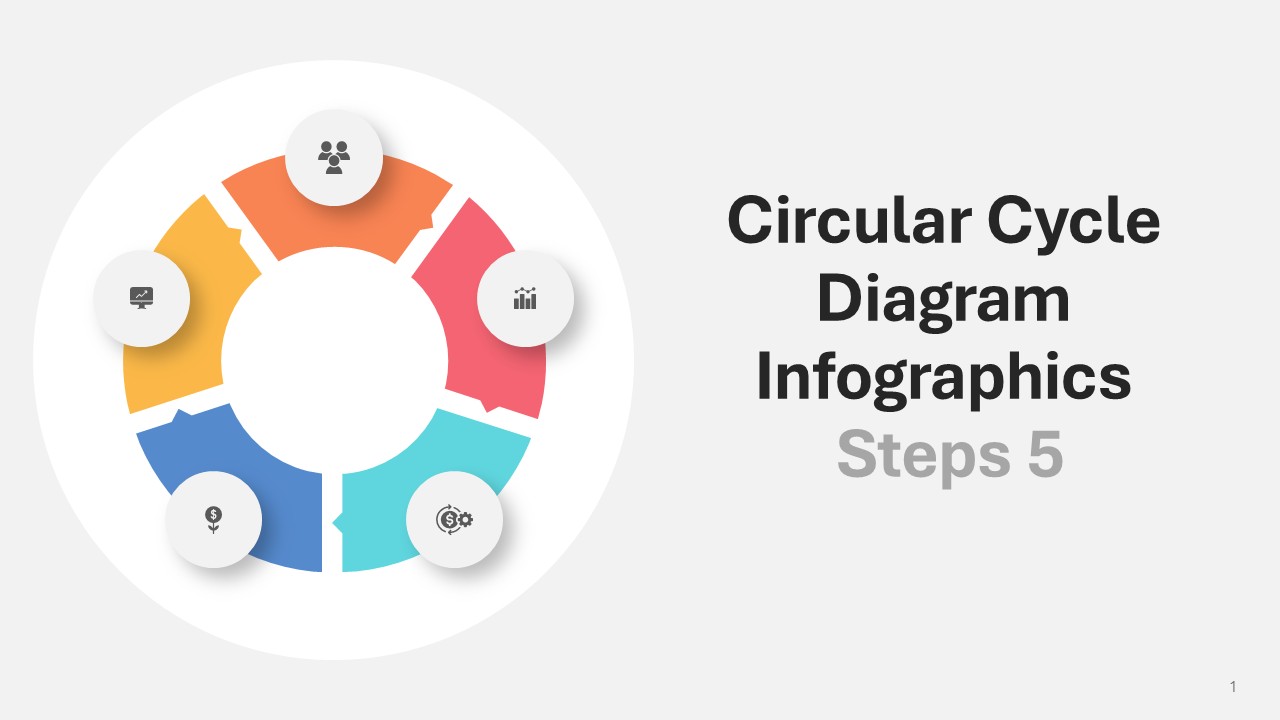
The Circular Cycle Diagram Steps 5 Infographics PPT Template advances circular narrative frameworks through 13 precisely calibrated slides. Fueled by a thermodynamic color scheme of ignition yellow, catalytic orange, intensity red, flow cyan, and resolution blue, it morphs complex workflows into intergenerational graphic ecosystems. Targeted at strategists, engineers, and educators, it transmutes “ideate-build-launch-optimize-scale” journeys into seamless orbital paths where movement feels both thorough and quantifiable.
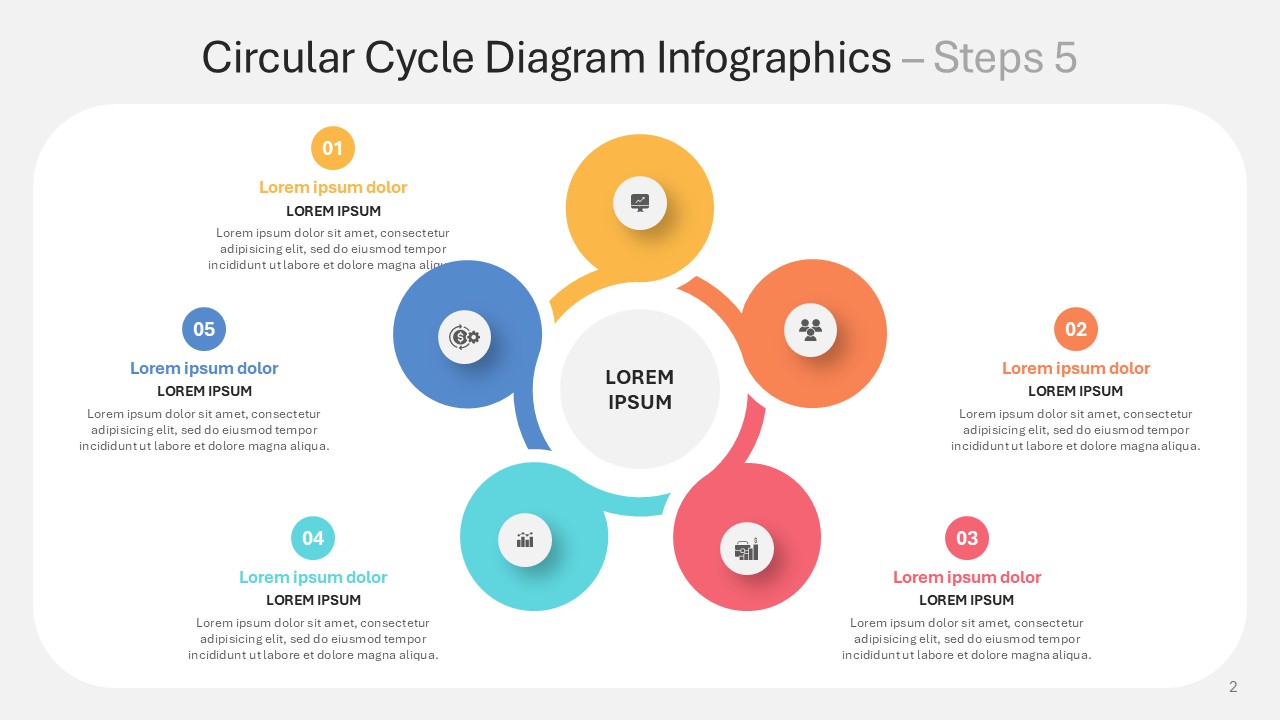
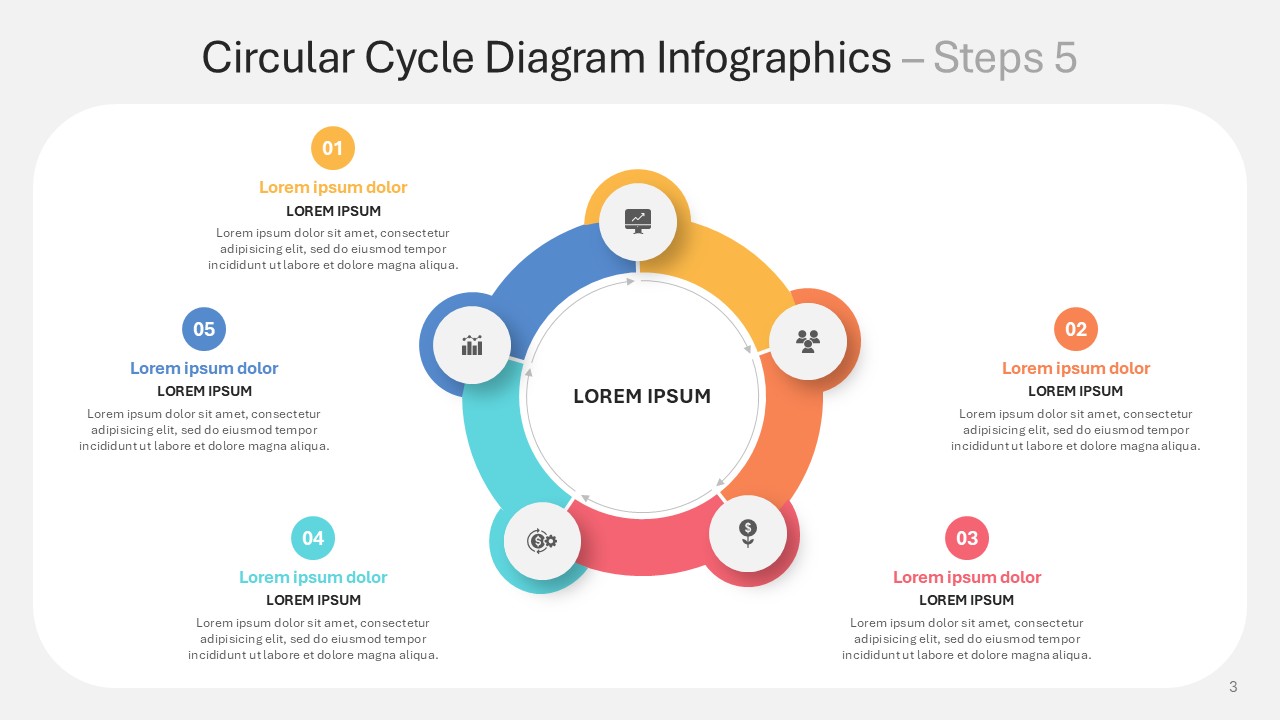
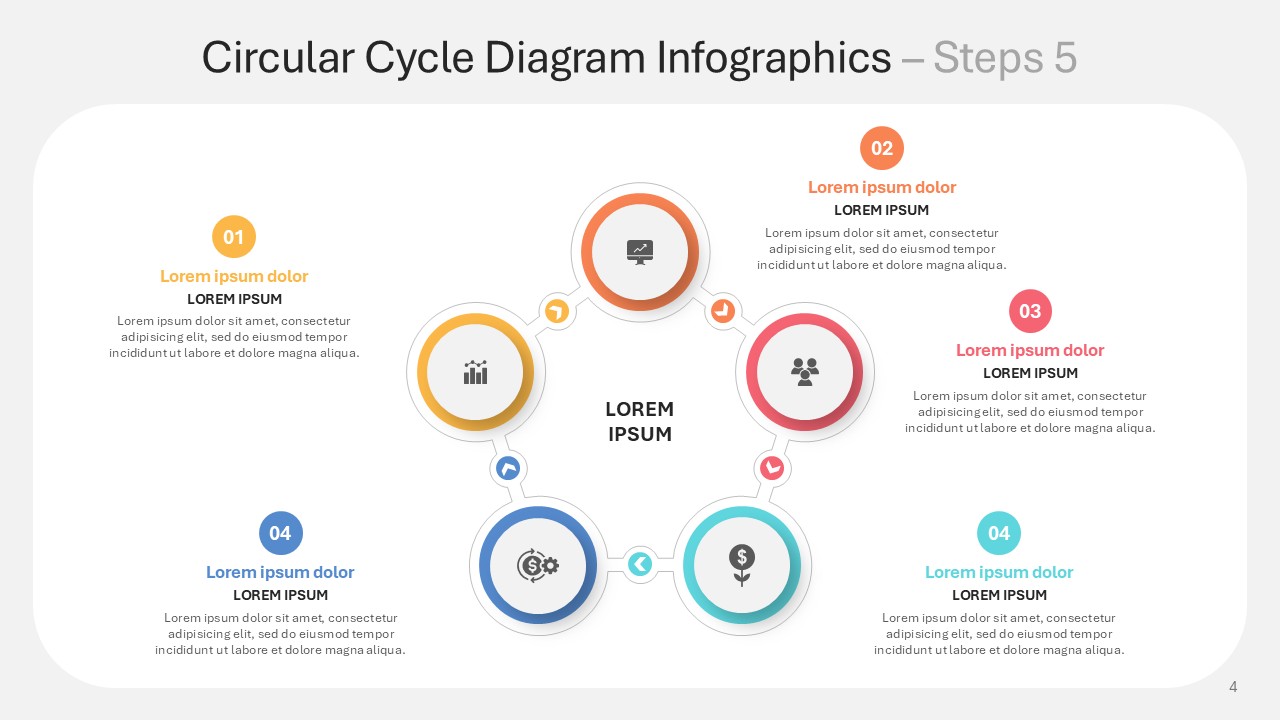
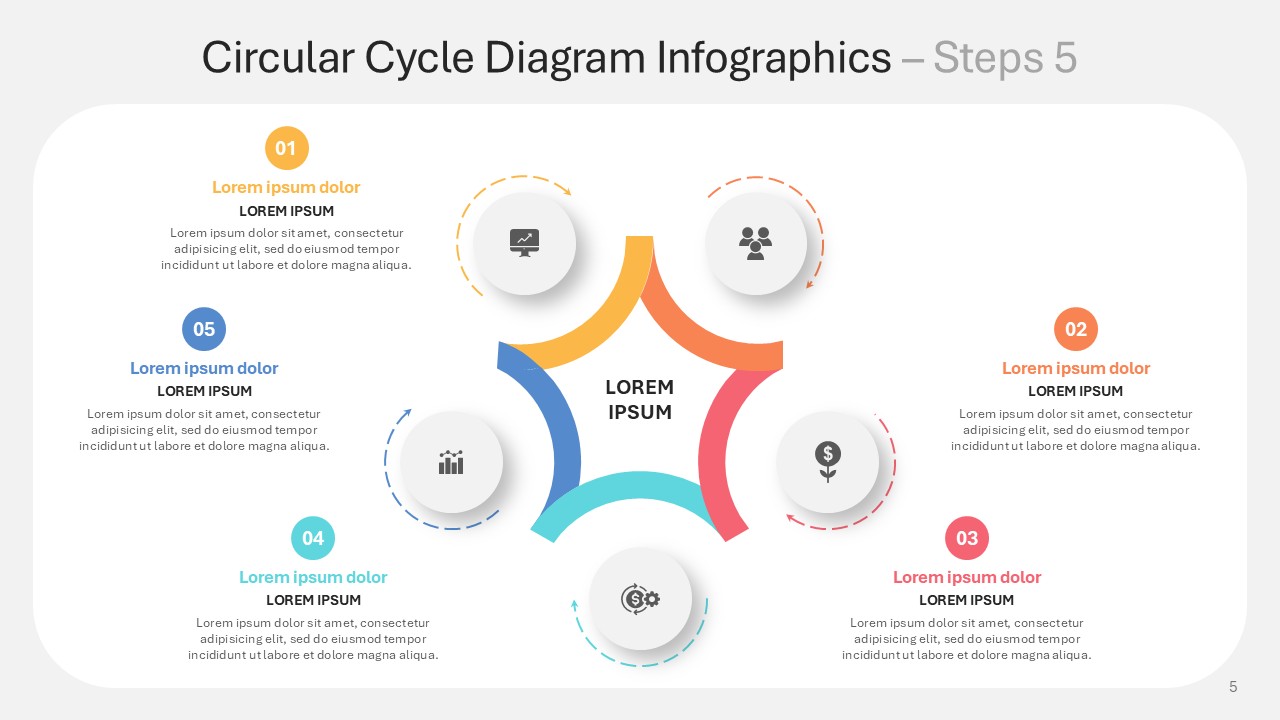
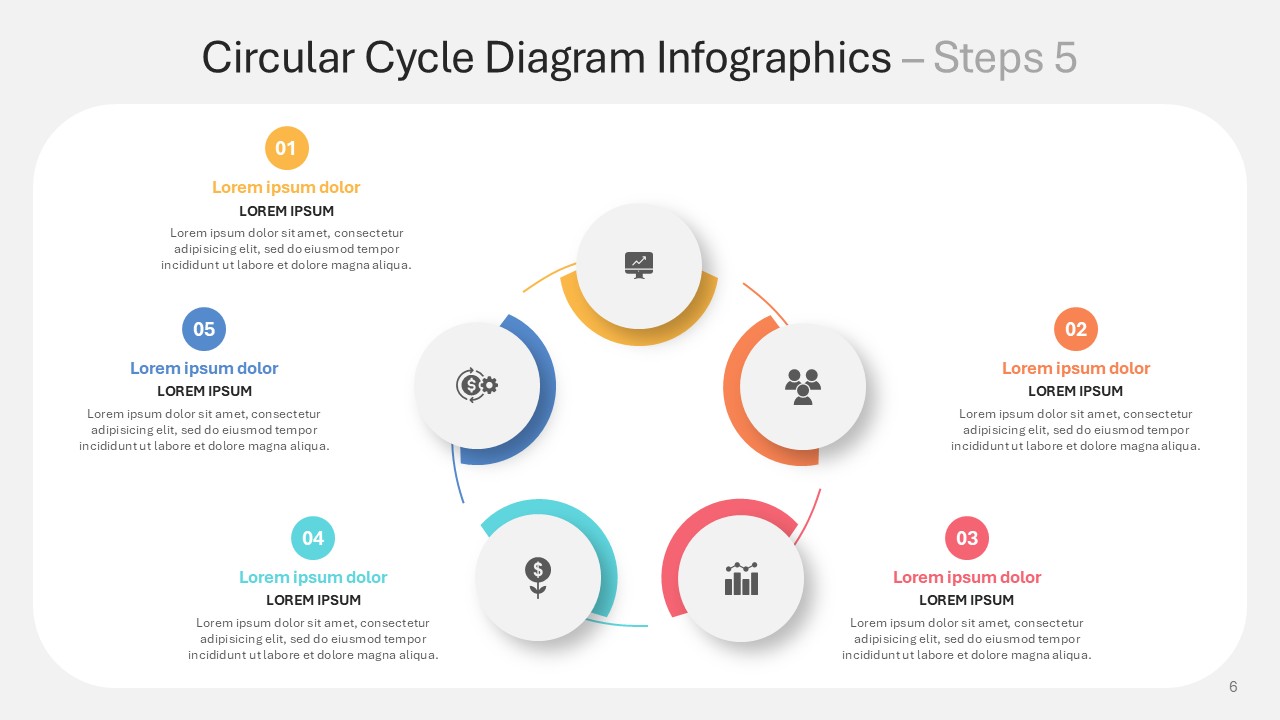
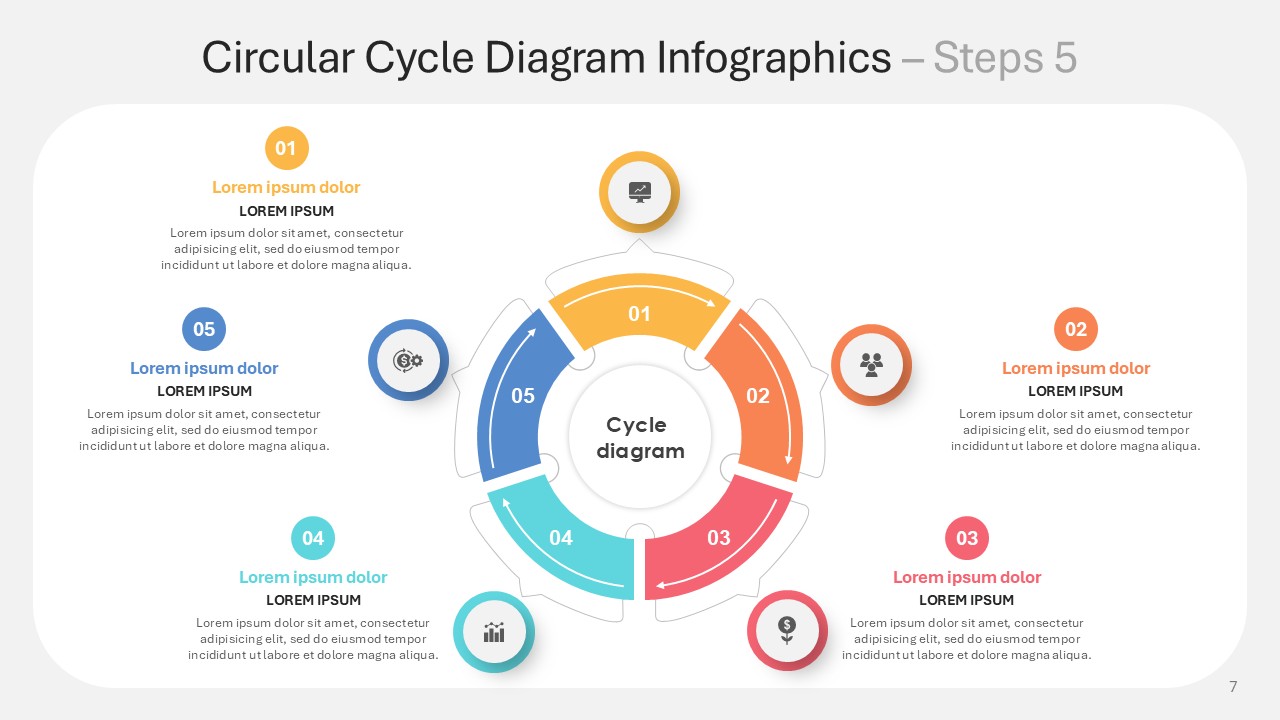
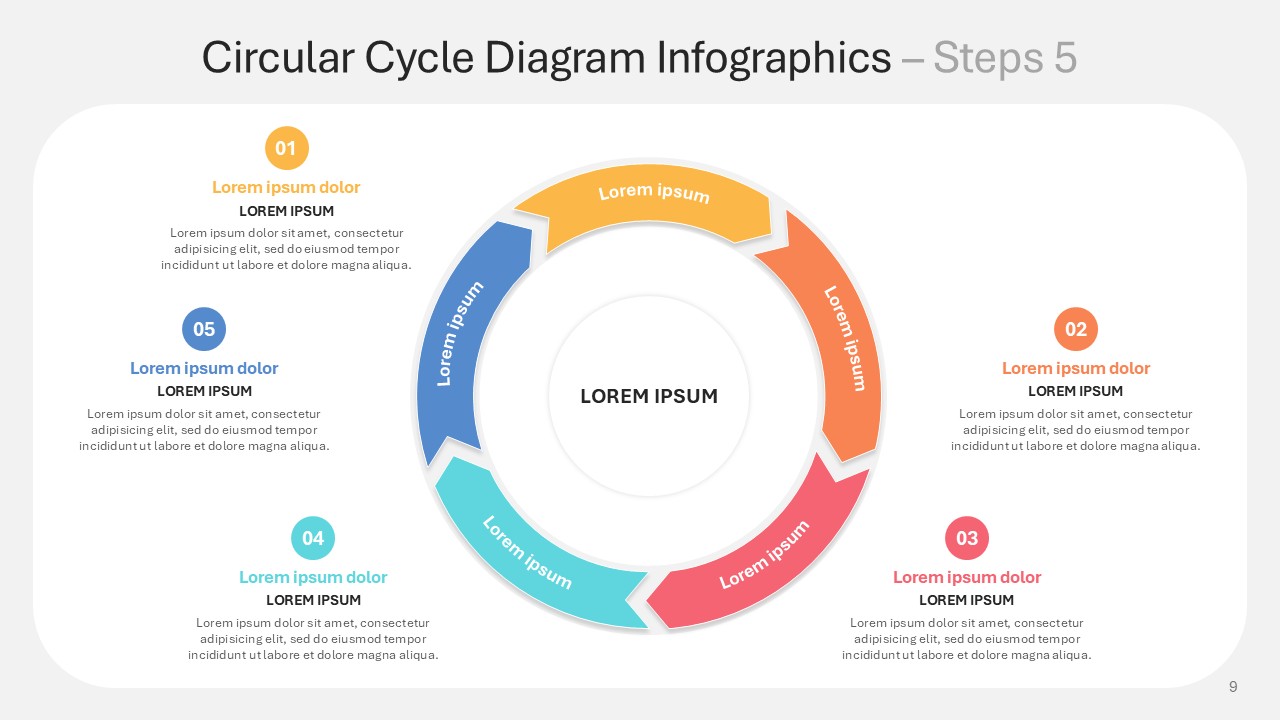
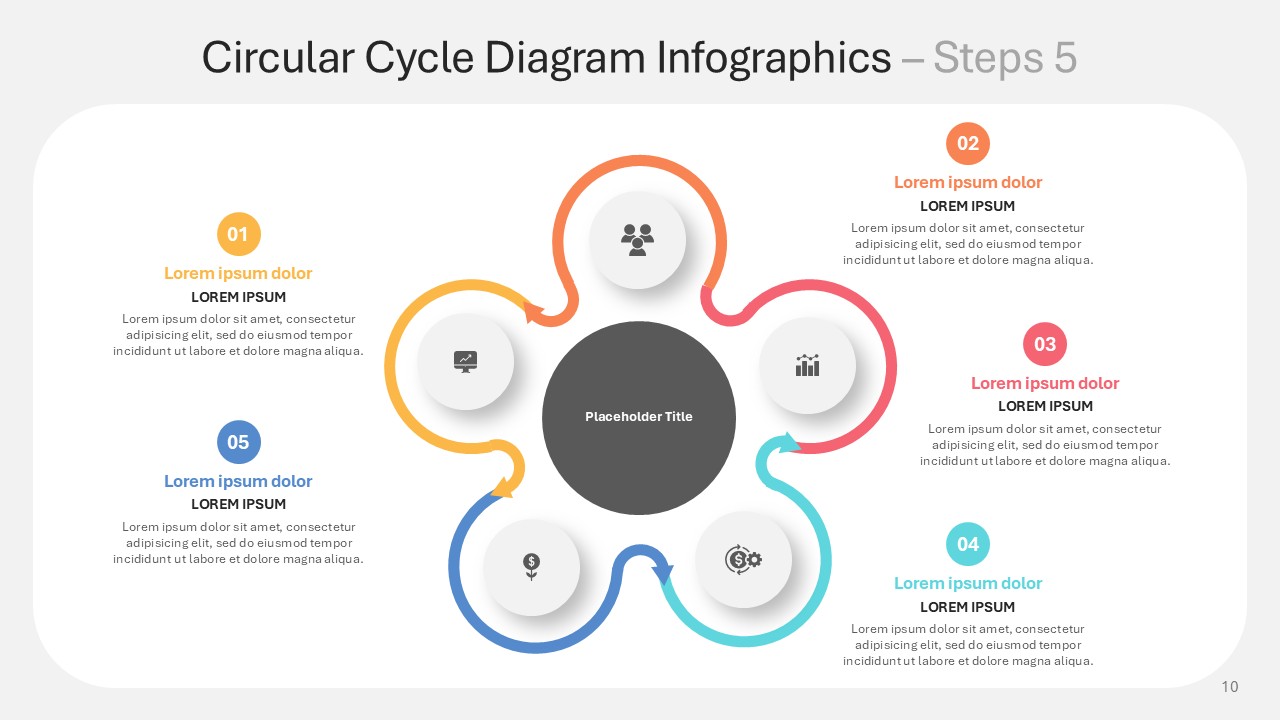
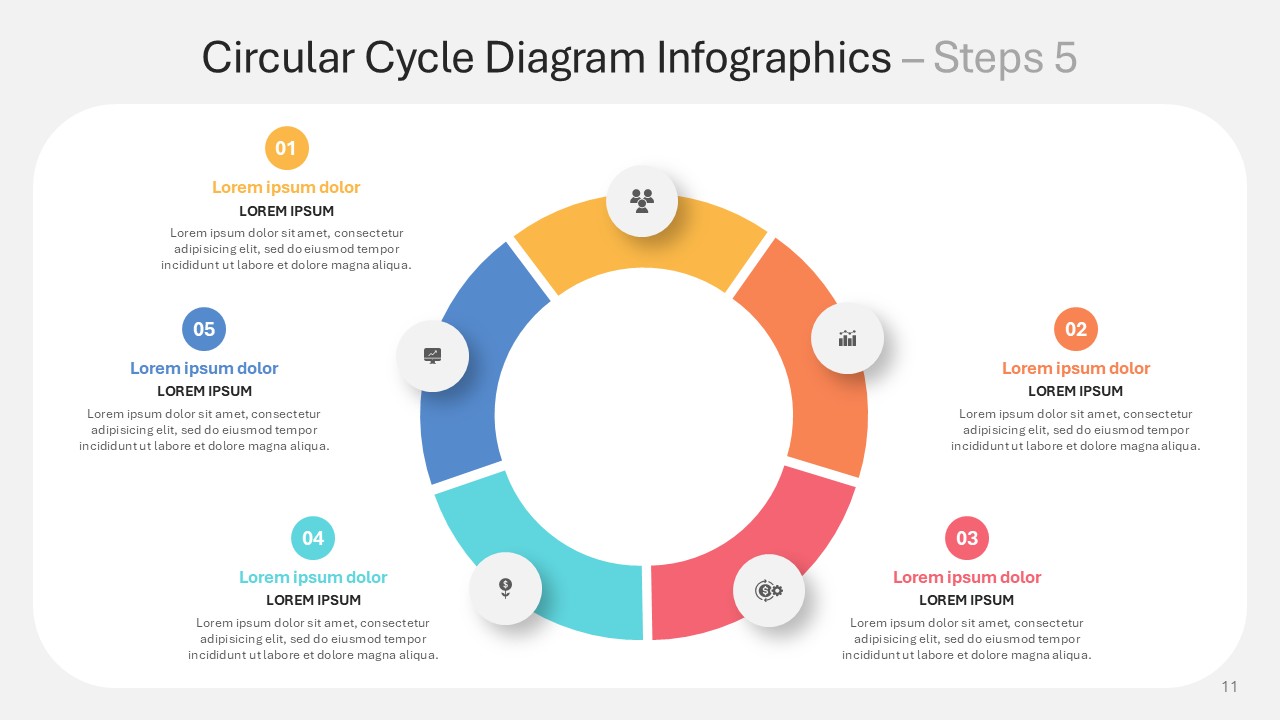
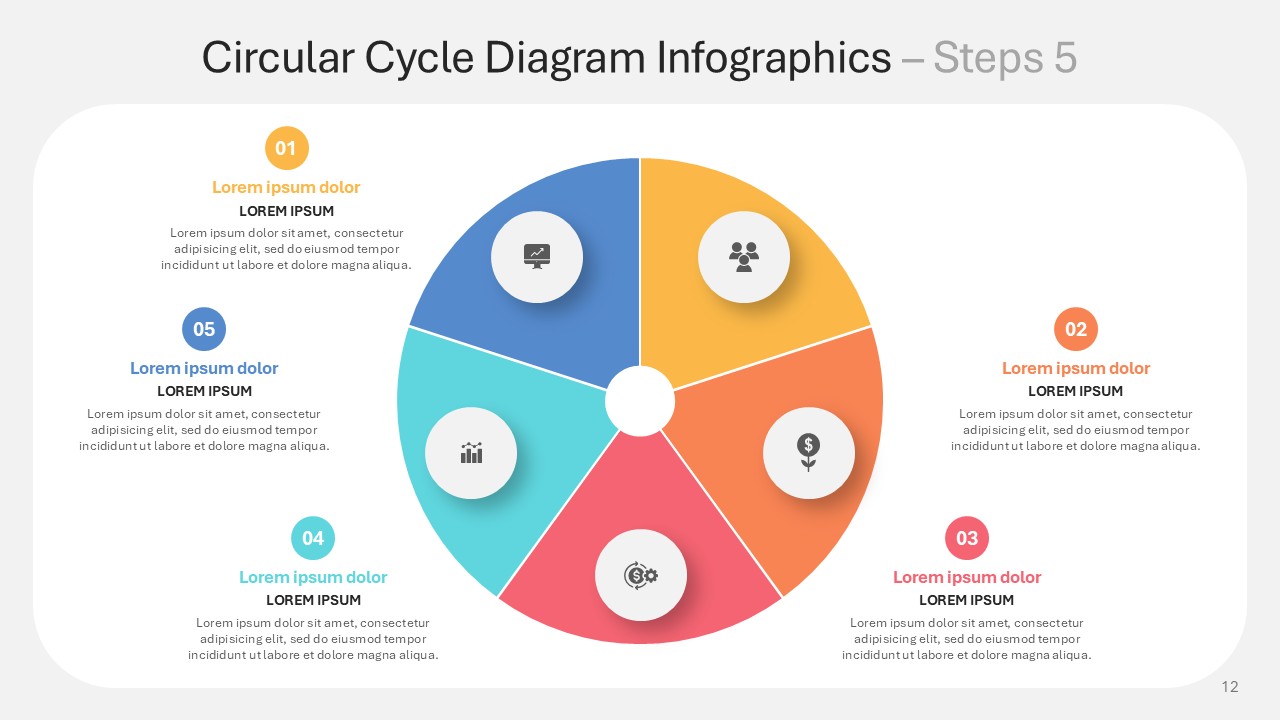
The Circular Cycle Diagram Steps 5 Infographics PPT Template leverages a five-phase architecture to master high-order process rendering. Every slide disaggregates a cycle into toward-pointed segments: conception (yellow), development (orange), activation (red), integration (cyan), and maturation (blue). Users will find rotating gear constellations, reciprocal pentagonal modules, and radial progression arcs that synthesize agile development sprints with circular economy frameworks. The template performs where monolithic diagrams falter, uniting iterative innovation within a circumscribed, harmonious lattice.
Yellow sparks ideation energy, orange nourishes rapid prototyping, crimson ignites market penetration, cyan synchronizes systems integration, indigo embeds scalable durability. Integrate your workflow instantly via PowerPoint or Google Slides. Replace default icons with discipline-specific images, retint phase segments to harmonize with corporate palettes, or condense/lengthen intervals to mirror practical cadence. The Circular Cycle Diagram Steps 5 Infographics PPT Template offers flexible counterparts for PDCA cycles, innovation funnels, and expansion-oriented flywheels, each variant designed for seamless editing beyond graphic restrictions.
Especially useful for R&D directors charting drug discovery roads, manufacturing executives depicting quality feedback loops, sustainability officers mapping circular value streams, or instructors clarifying complex systems biology. The Circular Cycle Diagram Steps 5 Infographics PPT Template becomes essential for Six Sigma submissions, agile transformation blueprints, and investor dossiers where multi-phase sequences require microscopic transparency.
Download the Circular Cycle Diagram Steps 5 Infographics PPT Template to disrupt conventional linear reasoning. Convert disjointed processes into self-reinforcing ecosystems in which advancement appears as a visual certainty, allowing intricacy to yield to refined simplicity.
Template Specifications
Name: | Circular Cycle Diagram Steps 5 Infographics PPT Template |
Quantity: | 13 slides |
Ratio: | 16:9 |
Colors : | |
Rating: | Premium |
Tutorials: | Click Here to View More |
SlidesBrain offers presentation features that allow you to customize every aspect of your slides. This means you can modify text, images, colors, fonts, and icons to your liking. Additionally, adjusting graphs in PowerPoint is simple, enabling you to change colors, numbers, and labels to match your preferences and create the perfect presentation.
Looking for a slide or PPT that’s uniquely yours? Our presentation design agency is here to help make your ideas a reality. As a leading presentation design company, we focus on delivering premium-grade bespoke presentations that engage your audience and ensure message retention. Kindly get in touch with us for professional custom presentation design services and transform your brand’s message for the purpose that you have in mind.
Premium Template
Unlock this template and gain unlimited access
Template Specifications
Dimensions
15 Slides, 1366 x 768 pixels – 16:9 Aspect Ratio (HD Presentation Quality)
Format
Download as a PPT to share with your recipient or generate a shareable link for online sharing.
Customizable
This template can be fully customized. You can edit content, change image(s), apply custom colors, input your own fonts and logo, and more.
Related tags
Related Presentations
No related products found.
-
basic shapes
Cybersecurity Trends Infographics PowerPoint Template
Rated 0 out of 5basic shapes | 7 slides 16:9 -
basic shapes
Cybersecurity Statistics Infographics PowerPoint Template
Rated 0 out of 5basic shapes | 8 slides 16:9 -
blue
Circular Cycle Diagram Steps 6 Infographics PPT Template
Rated 0 out of 5business | 13 slides 16:9 -
blue
Circular Cycle Diagram Steps 5 Infographics PPT Template
Rated 0 out of 5business | 12 slides 16:9 -
blue
Circular Cycle Diagram Steps 4 Infographics PPT Template
Rated 0 out of 5business | 15 slides 16:9 -
business
Circular Cycle Diagram Steps 3 Infographics PPT Template
Rated 0 out of 5business | 11 slides 16:9
Related products
-
blue
United States Olympics team in the Paris Olympics 2024 Presentation Template
Rated 0 out of 5education | 20 slides 16:9 -
Business
Editable WhatsApp Web SWOT Analysis PowerPoint Template
Rated 0 out of 5Business | 11 slides 16:9
Customer Reviews
“A review from a customer who benefited from your product. Reviews can be a highly effective way of establishing credibility and increasing your company's reputation.”
Customer Name
“A review from a customer who benefited from your product. Reviews can be a highly effective way of establishing credibility and increasing your company's reputation.”
Customer Name