
How to Build a Pitch Deck Competitor Matrix That Proves Your Moat (With Examples)

Quick answer: A pitch deck competitor matrix is a table or chart that compares your startup with rivals on key criteria. It proves your moat when the criteria you pick are the ones rivals cannot easily copy.
Investors see dozens of decks a week. Many say, “We have no competition.” That line kills trust fast. A better move is to show the competition and then show why you win. A pitch deck competitor matrix does exactly that. It puts you and your rivals side by side on the criteria that matter. Done well, it proves your moat in about ten seconds.
This guide shows you how to build one in six steps. You will also see three examples you can copy. If you want to skip the design work, SlidesBrain has editable competitor analysis slides you can drop into your deck today.
What Is a Pitch Deck Competitor Matrix?
A competitor matrix is a single slide that maps you against other players. The rows or axes show criteria. The columns or dots show companies.
- It answers three investor questions:
- Who else solves this problem?
- How are you different?
- Can that difference last?
The third question is the moat. A moat is a lasting advantage that protects your business from rivals. Without it, a good product is just a head start.
Want to represent your pitch deck competitor matrix in a professional way without spending hours in editing templates? Try our latest competitive analysis presentation template.

This template is completely editable to design according to your requirement. It comprises of over 20 slides specifically designed to examine market dynamics and competitors across multiple sectors. You can custom designed it in PowerPoint and Google Slides both.
Why Investors Care About Your Moat Matrix?
Investors back companies that can stay ahead. A good idea attracts copycats. A big company can also add your feature in one quarter. The investor needs to know what stops that.
Your matrix gives a clear answer. It shows you understand the market. It also shows you know where you are strong and where you are not. That honesty builds trust before you say a word. For instance, while presenting information on business risk assessment matrix, investors always look for clean, concise, and robust data instead of puzzling presentation.
If you are looking for a risk assessment presentation, try our risk assessment matrix modern quote PowerPoint Presentation and Google Slides

This easy to edit slides is sophisticatedly design to present a clear roadmap of business risk assessment, ensuring impactful presentation of business health. It consists of 10 editable templates that are designed for business analysts, project managers, compliance team members, consultants, and corporate professionals.
What Counts as a Moat?
Before you build the matrix, name your moat. Investors usually look for one of these:
- Network effects: The product improves a more people use it.
- Switching costs: Leaving you is painful or expensive.
- Proprietary data: You own data rivals cannot get.
- Cost advantage: You deliver at a lower cost as you scale.
- IP or regulation: Patents, licenses, or approvals protect you.
- Brand and trust: Buyers pick you by default.
Pick one or four moat matrix. Then build the matrix around them. A matrix that lists twenty features proves little. A matrix built around your moat proves a lot. If you want to present a data around four competitive matrix, then try quad chart template PowerPoint templates editable slides and Google Slides
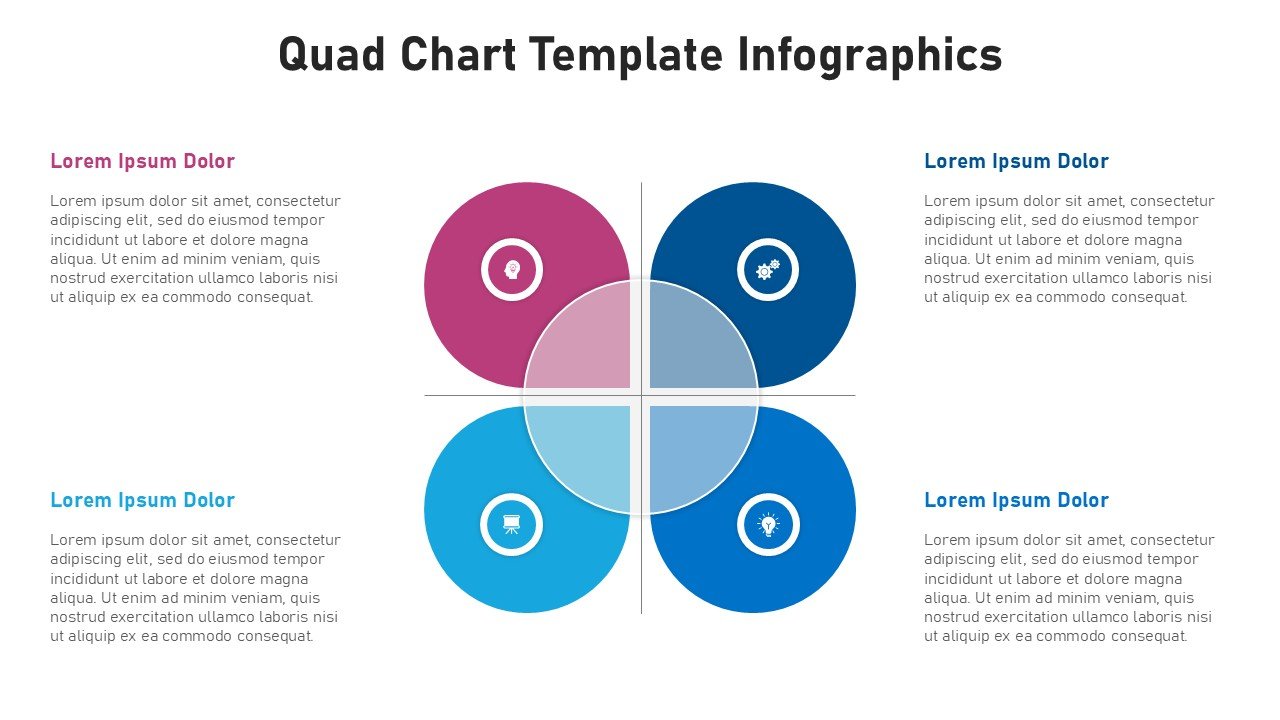
This template is ideal to present 2-4 moat matrix and present data in a comparison way. Highly vibrant color coordination and white spacing along with elegant theme made this template perfect for business analyst and team presentation.
How to Build a Competitor Matrix in 6 Steps?
Step 1: List the Right Competitors
Include three groups. Direct rivals sell the same thing. Indirect rivals solve the problem another way. The status quo is what customers do today, such as spreadsheets or manual work. Investors often see the status quo as your biggest rival. Keep the list to four or five names.
Step 2: Choose Criteria That Point to Your Moat
Pick five to seven criteria. Each one should matter to the buyer. At least two should link to your moat. If your moat is proprietary data, add a row like “Learns from customer data.” If it is switching costs, add “Deep workflow integration.”
Step 3: Pick the Right Matrix Format
Three formats work best:
- Feature checklist: a table with ticks and crosses. Best for product-led startups.
- 2×2 positioning map: two axes or 2-2 matrix infographics with each company as a dot. Best for showing a gap in the market.

- Moat scorecard: rows for each moat type, scored for you and your rivals. Best for later-stage decks.
SlidesBrain offers matrix slide layouts and table infographics for all three, so you can switch formats in a few clicks. Example, budget table infographics PowerPoint template
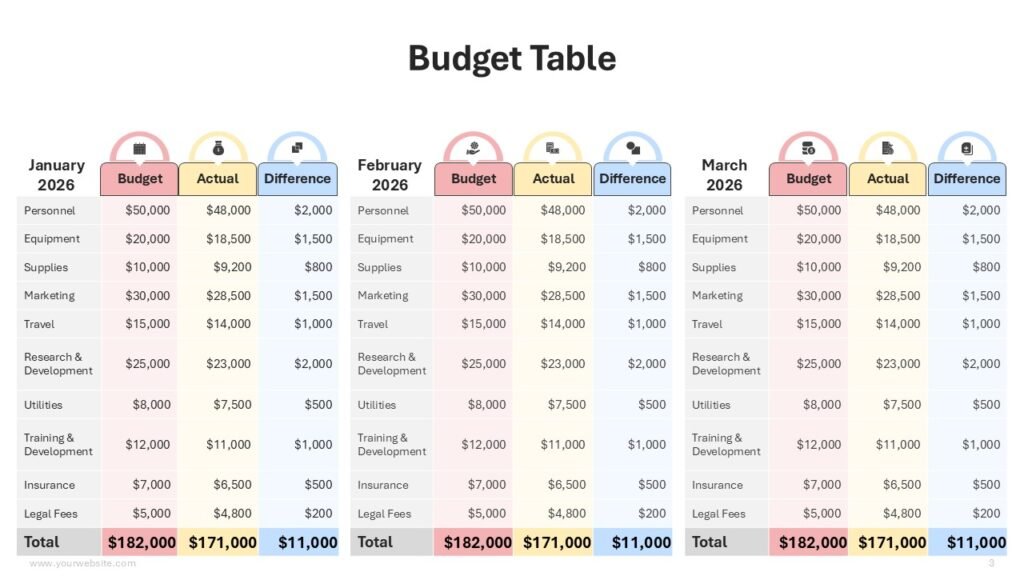
This template consists of 16 editable slides specifically for financial reporting decisively beyond traditional spreadsheets. It is designed for project leads, and senior executives to ensure that each finance goal is delivered with authoritative clarity, inviting instant understanding.
Step 4: Score Honestly
Do not tick every box for yourself and leave rivals empty. Investors will check. If a competitor does something well, say so. Credibility is worth more than a perfect score. Add proof where you can, such as a customer quote, a pilot result, or a public pricing page.
Step 5: Highlight the Moat Rows
Shade or outline the rows that show your moat. Add one short takeaway line under the table, such as “Only RouteLoop learns from every delivery it makes.” The takeaway tells the investor what to see.
Step 6: Design for a Five-Second Read
Use one slide and short text. Use your brand color for your column and grey for the rest. Limit the table to six or seven rows. A cluttered matrix hides the moat. Before you design the final slide, a SWOT infographic can help you sort strengths and gaps. You can try our free SWOT template infographics PPT Google Slides template
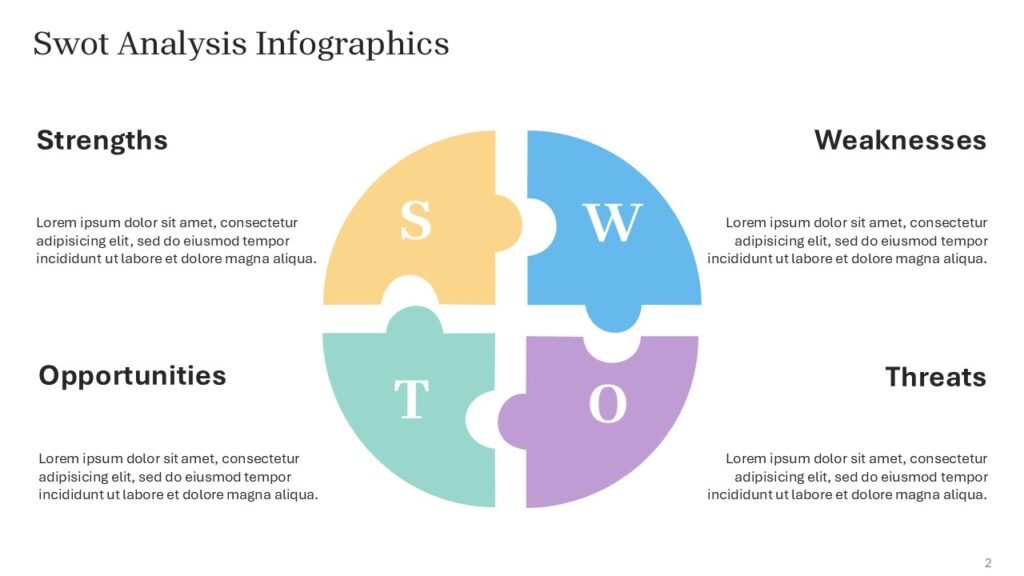
This template is free to use and ideal for small to mid-level businesses for presenting their business SWOT Analysis.
Example 1: Feature Checklist Matrix
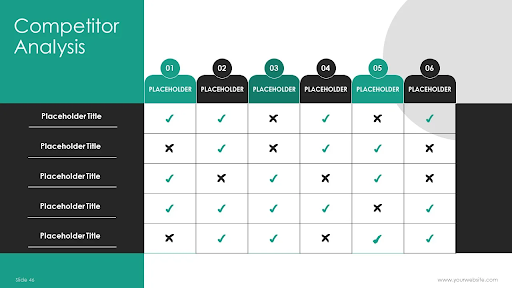
Imagine RouteLoop, a fictional startup that sells delivery routing software to local grocers. Here is how its matrix might look.
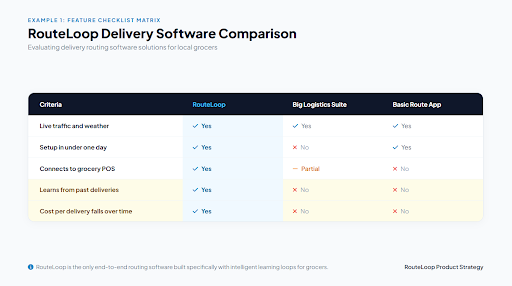
What this Proves: The moat is the learning loop. Every delivery adds data, and rivals start from zero. The first three rows show RouteLoop is competitive on basics. The last two rows carry the story.
Example 2: 2x2 Positioning Map
Now picture PayNest, a fictional fintech for freelancers. The axes are “Ease of use” and “Depth of tax tools.” Banks sit at deep but hard to use. Simple invoicing apps sit at easy but basic. PayNest sits alone in the top right: easy and deep.
The empty space around you is the story. But a 2×2 alone does not prove a moat. Add a line that explains why rivals cannot move there fast. For example: “Compliance rules sit inside our core engine, which took three years to build.”
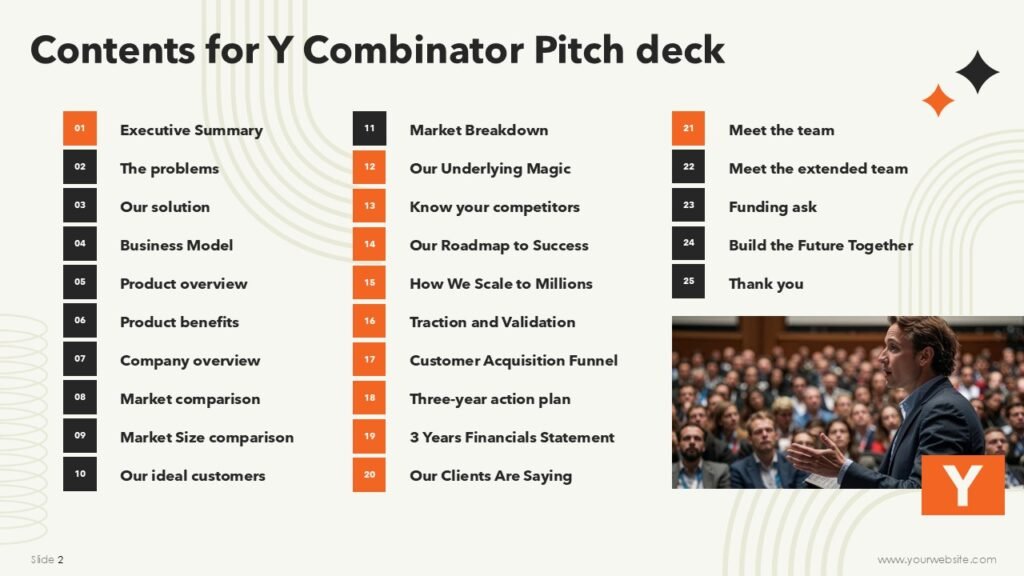
Founders who want a clean base can start with the Y Combinator minimal pitch deck. Its simple layouts leave room for one clear 2×2 on the competition slide.
Example 3: Moat Scorecard
Later-stage startups often use a scorecard. Rows are moat types. Each company gets a score from low to high.
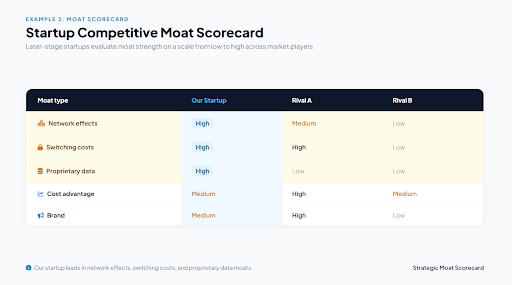
Notice that the startup does not win every row. It leads where its story is strongest. That honesty makes the high scores believable. This format fits well in a Series A pitch deck, where investors expect proof of defensibility.
Where Does the Matrix Go in Your Deck?
Most decks place it after the solution and market slides, around slide six or seven. By then the investor knows the problem and the size of the prize. The matrix answers the next thought: “Why you?”
Raising your first round? A seed and pre-seed pitch deck template already has a competition slide in the right spot. Pitching a technical product? The tech startup pitch deck template has layouts for product comparison and technical edge.
Common Mistakes to Avoid
- Claiming “no competitors.” Investors read it as weak research.
- Using vanity criteria. “Great team” and “modern design” are claims anyone can make.
- Overloading the table. More than seven rows blurs the message.
- Ignoring the status quo. Spreadsheets and manual work are real rivals.
- Never updating. Competitors change. Refresh the matrix before every meeting.
A Quick Checklist Before You Send
- Does the slide name four or five real competitors, including the status quo?
- Do at least two rows point to your moat?
- Can a stranger read the takeaway in five seconds?
- Have you shown at least one row where a rival beats you?
Save Time With the Right Tools
You do not need to design from scratch. Try the SlidesBrain AI presentation maker to draft a competitor slide from a short prompt. Then refine it with your own data. If you want investor-ready polish, the custom presentation design team can build your full deck.
Final Thoughts
A strong competitor matrix does not hide rivals. It puts them to work. It shows investors you know the market and that your advantage is hard to copy.
Pick your moat. Choose five to seven criteria. Score honestly. Design for a quick read. Then start from a ready-made SlidesBrain layout and spend your time on the story.
Frequently Asked Questions
What is a competitor matrix in a pitch deck?
It is a slide that compares your startup with rivals on key criteria. It shows how you are different and why that difference lasts.
How many competitors should I include?
Four or five. Cover direct rivals, indirect rivals, and the status quo.
Which matrix format is best?
A feature checklist suits early-stage product teams. A 2×2 suits market gaps. A moat scorecard suits Series A and later.
Can I say I have no competitors?
No. Every problem has an existing solution, even if it is a spreadsheet. Show it and explain why you are better.