Template Specifications
| Name: |
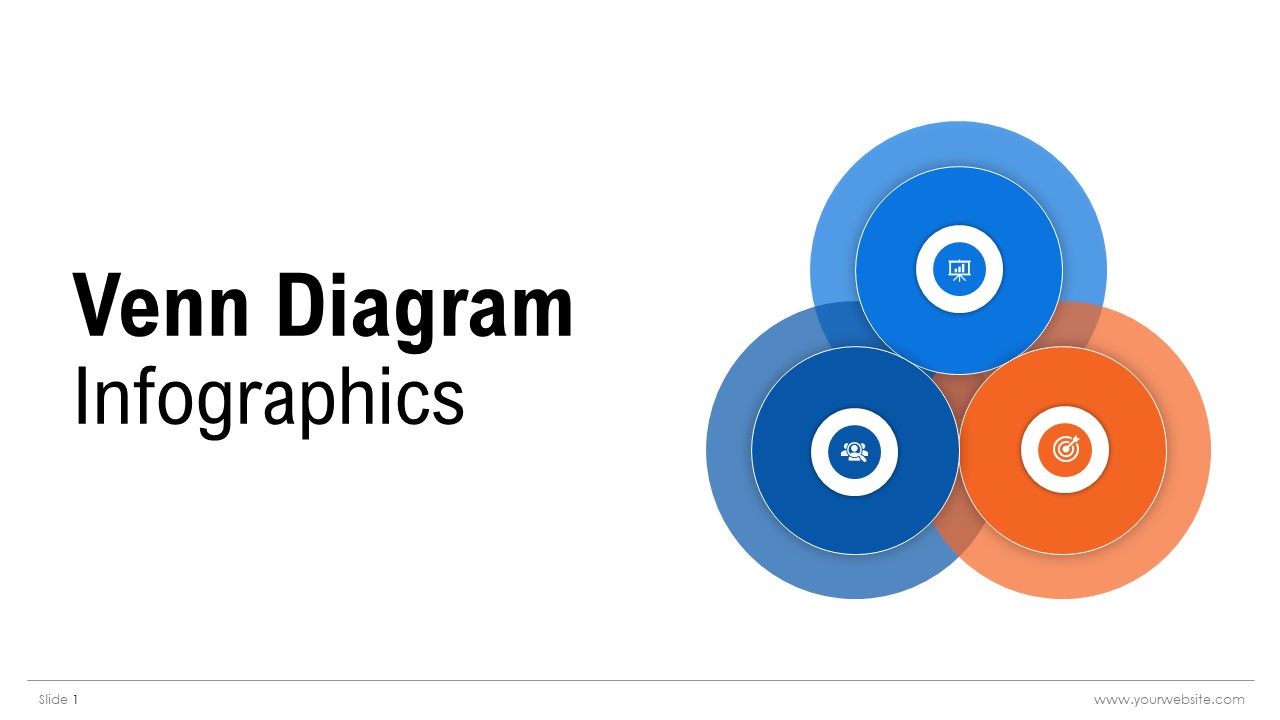
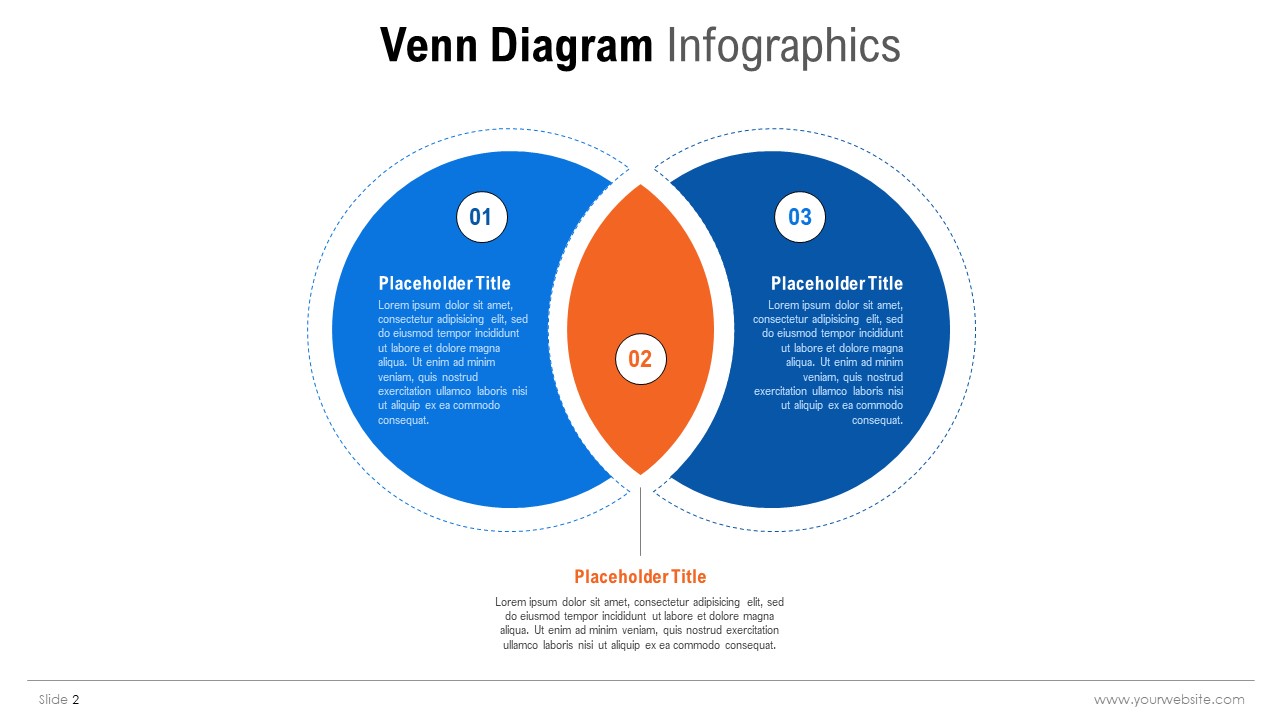
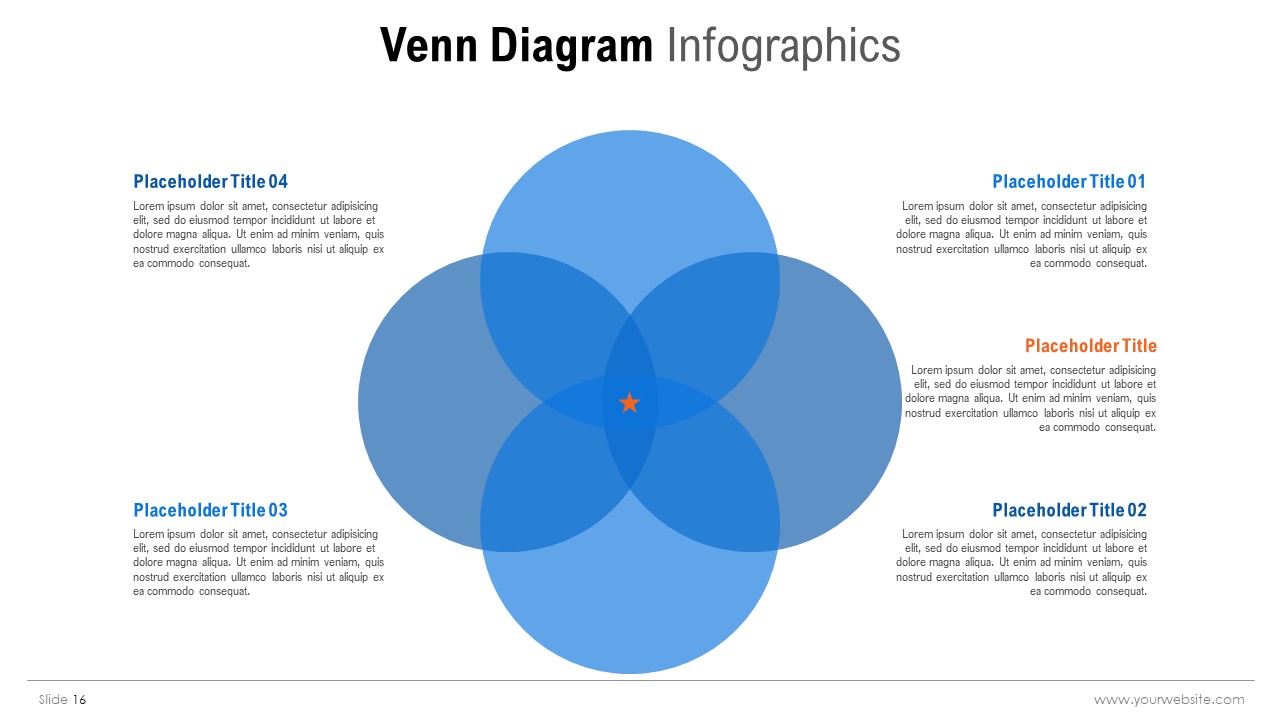
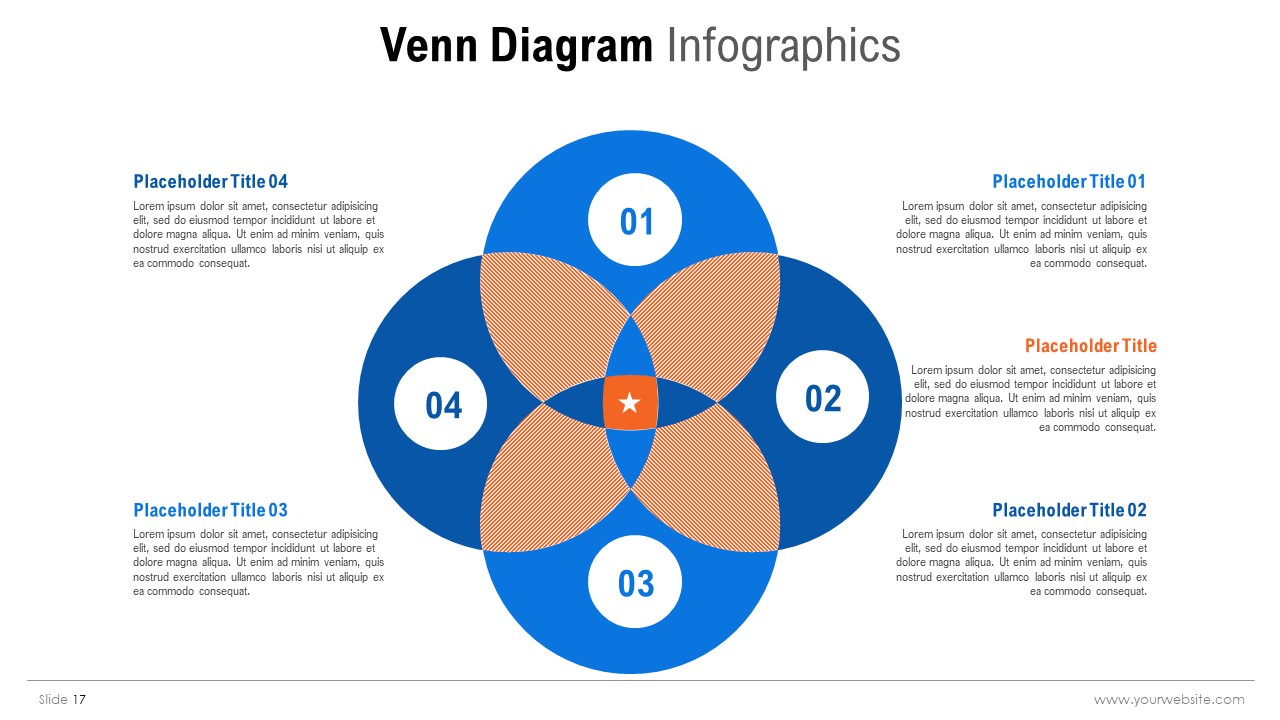
Venn Diagram Infographics |
| Quantity: |
18 slides |
| Ratio: |
16:9 |
| Colors : |
|
| Rating: |
Premium |
| Tutorials: |
Click Here to View More |
SlidesBrain offers presentation features that allow you to customize every aspect of your slides. This means you can modify text, images, colors, fonts, and icons to your liking. Additionally, adjusting graphs in PowerPoint is simple, enabling you to change colors, numbers, and labels to match your preferences and create the perfect presentation.


 MS Powerpoint