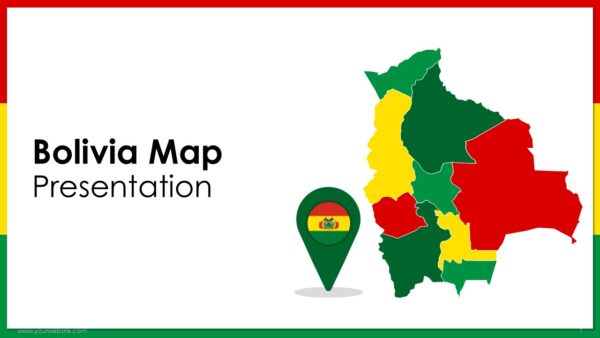
The Greenland Map Presentation Template is an exemplary, premium presentation slice with a bold red theme representing resilience, strength, and Greenland’s Arctic identity. This 18-slide template visually describes Greenland with the geographical divisions of its regions, population, and key socio-economic features like other succinct maps depicting Greenland in the Arctic region and demographic maps. It is useful for different types of presentations.
This template can be leveraged by government officials and NGOs for giving presentations on proposal developmental and environmental policy frameworks, infrastructural project blueprints, and data visualization. Business professionals will use it for market analysis, regional expansion, and resource mapping. In its broadest context, students and educators across disciplines will utilize it for geography, environmental studies, and history. Its editable structure allows users to adjust the focus of all maps-specific areas of interest, ensuring an engaging experience during the presentation.
This template permits users to assess Greenland’s distinct surrounding landscape alongside its economic possibilities as the focal key region for discussion enabling presenters to outline essential development factors. Suitable for corporate, educational, and tourism presentations, this template ensures informative presentations for researchers, policy analysts, business strategists, and academics through customization without losing visual effectiveness.
It is fully customizable to your requirements and works effortlessly with Google Slides and PowerPoint. Obtain it now to design a well-organized, informative, and striking presentation about Greenland.
SlidesBrain offers presentation features that allow you to customize every aspect of your slides. This means you can modify text, images, colors, fonts, and icons to your liking. Additionally, adjusting graphs in PowerPoint is simple, enabling you to change colors, numbers, and labels to match your preferences and create the perfect presentation.
“A review from a customer who benefited from your product. Reviews can be a highly effective way of establishing credibility and increasing your company's reputation.”
★★★★★Rated 5 out of 5
“A review from a customer who benefited from your product. Reviews can be a highly effective way of establishing credibility and increasing your company's reputation.”


 MS Powerpoint