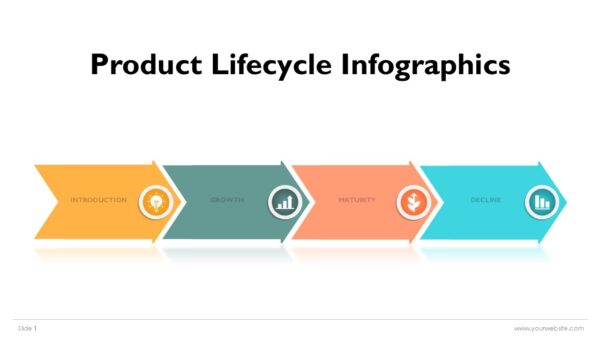
The Customer Journey Maps PowerPoint Infographics consists of 27 slides which aim to depict, assess, and drive strategic insight for each step of a customer’s journey. The template uses a variety of behavioral analytics and touchpoint analyses. The template is designed for UX strategists, marketing directors, product managers, and service designers. The Customer Journey Maps PowerPoint Infographics covers the structured visual frameworks for the awareness, consideration, purchase, and advocacy phases. This allows the cross-functional teams to work in unison to achieve a shared vision.
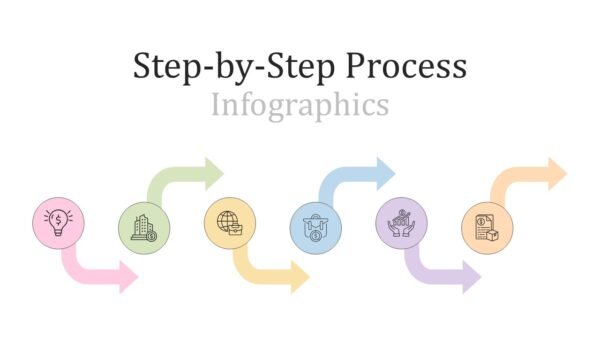
Each infographic is designed to the modular for the larger customer narrative and is able to present journey maps. This gives the Customer Journey Maps PowerPoint Infographics multiple layouts which are designed for persona profiling, emotion curve integration, channel integration, and pain point systems. All of this is presented with a unifying visual of time, flow charts, and various other technical infographics in order to serve the complex journey maps to both technical and non-technical audiences.
The color-coded strategies work on all elements of psychological coding in a set. The use of colors in the Customer Journey Maps PowerPoint Infographics captures and guides the audience’s attention and reaction on a given friction point, decision/interaction highlight, or a high-energy point in orange; reaction and attention in a satisfaction/delight moment in yellow; and guides audience attention to the pathways of growth, loyalty, and conversion in yellow. audience guides attention and reaction to the pathways of growth and conversion in green. The outlines and guiding audience attention and reaction to pathways of growth and conversion in green. Colors coded the emotion and behaviors in the customer life cycle. The use of Customer Journey Maps PowerPoint Infographics colors codes emotions and behaviors to facilitate the audience in navigation through the various phases of the life cycle of a customer.
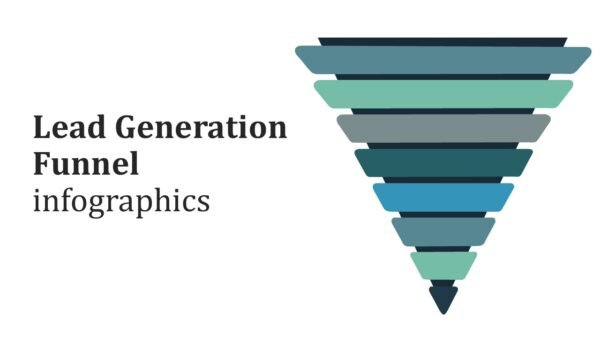
In addition to basic journey mapping, the collection offers unique infographics that highlight the ability to compare several persona pathways, illustrate behavior over channels, assess journey ROI, and analyze the internal handoffs that create seamless experiences. The Customer Journey Maps PowerPoint Infographics are meant to integrate customer insights with business strategies by transforming qualitative and quantitative data into visually persuasive stories that compel the stakeholder to fund the necessary improvements in experience initiatives.
Premium Customer Journey Maps PowerPoint Infographics make it possible for you to customize your journey visualizations in detail for your specific industry, brand guidelines, and research. They are completely customizable in PowerPoint and Google Slides. This comprehensive tool is a “must have” for any workshop, presentation, or strategy meeting designed to cultivate customer empathy, close key experience gaps, and mobilize the organization around delivering superior end-to-end customer value.


 MS Powerpoint