Circular Cycle Diagram Steps 4 Infographics PPT Template
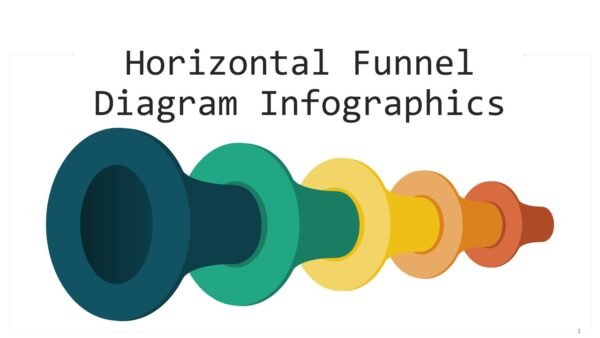
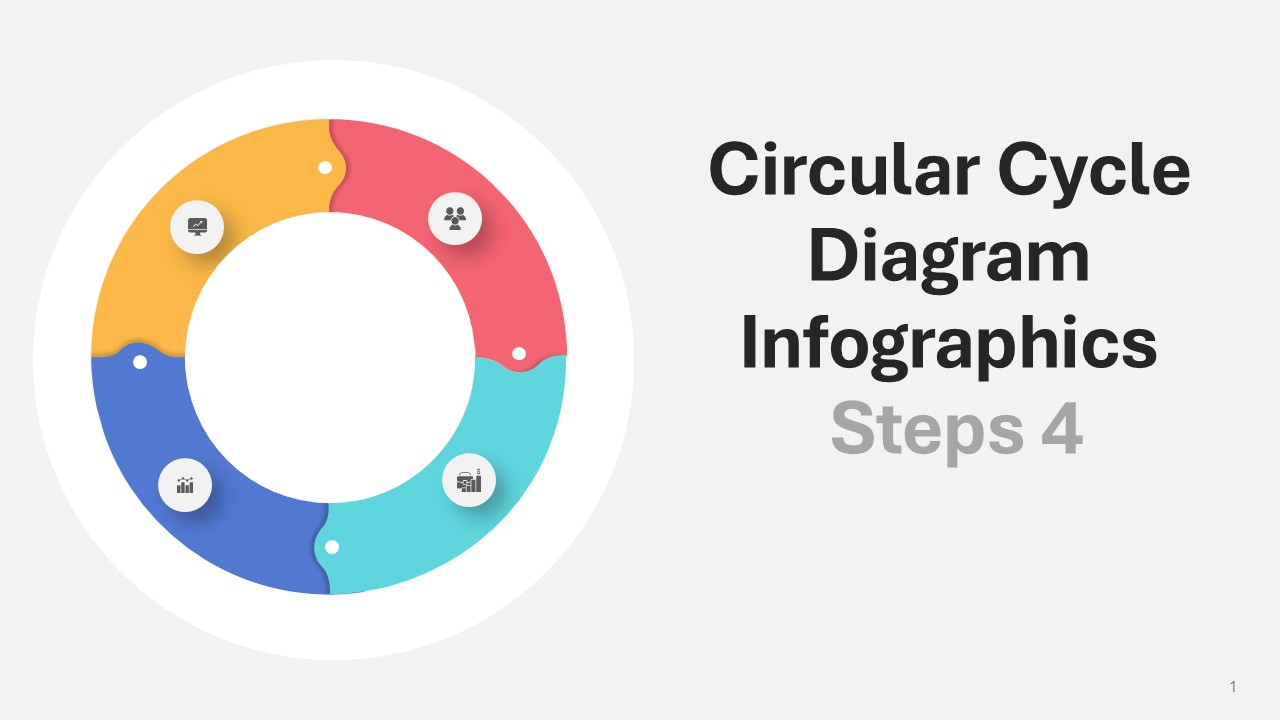
The Circular Cycle Diagram Steps 4 Infographics PPT Template enhances visual persuasion by embedding cyclical narratives in 15 purpose-built slides. Anchored in a vibrant color chain of ignition yellow, intensity red, flow cyan, and resolution blue, it reimagines multi-phase processes as hermetic visual organisms. Tailored for analysts, pedagocists, and systems designers, it metamorphoses the classic “plan-execute-evaluate-optimize” sequence into a set of orbitally distributed, seamlessly clickable nodes, affording viewers both the impression of relentless advancement and quantifiable stages.
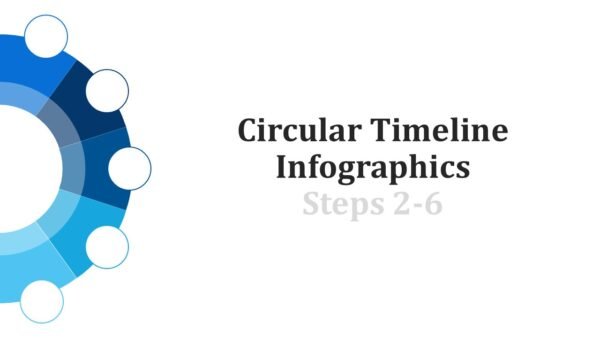
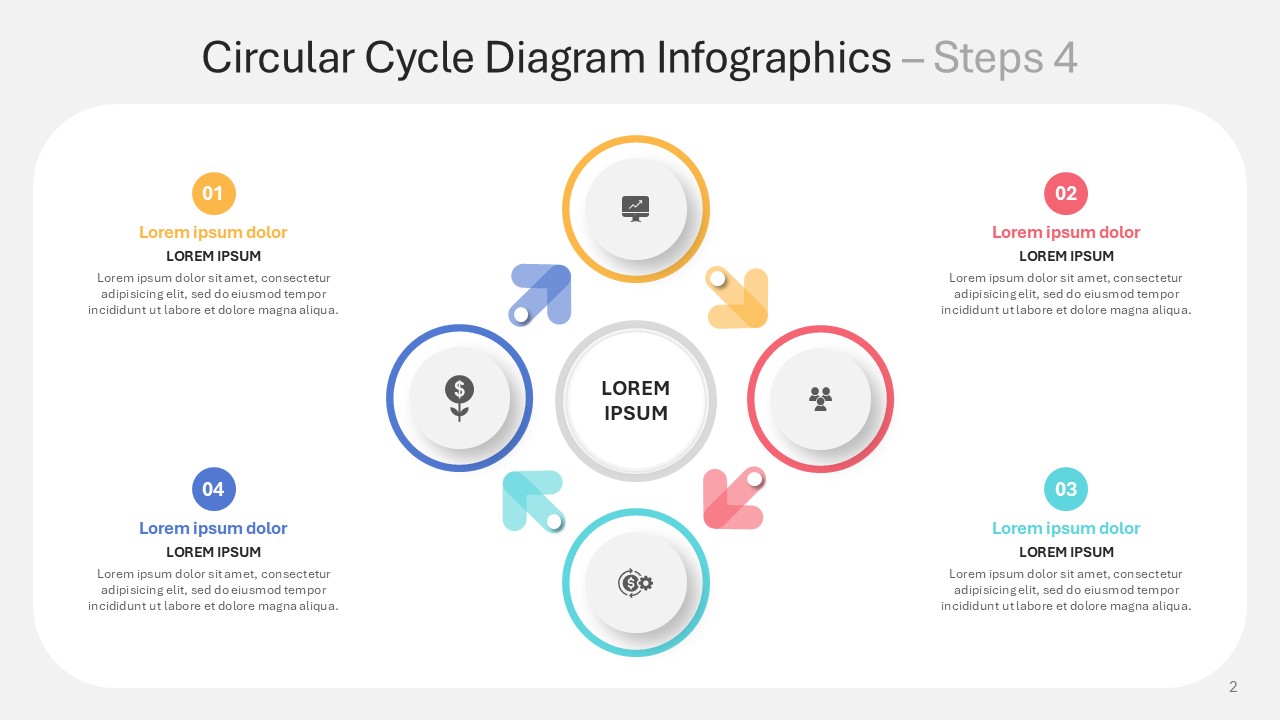
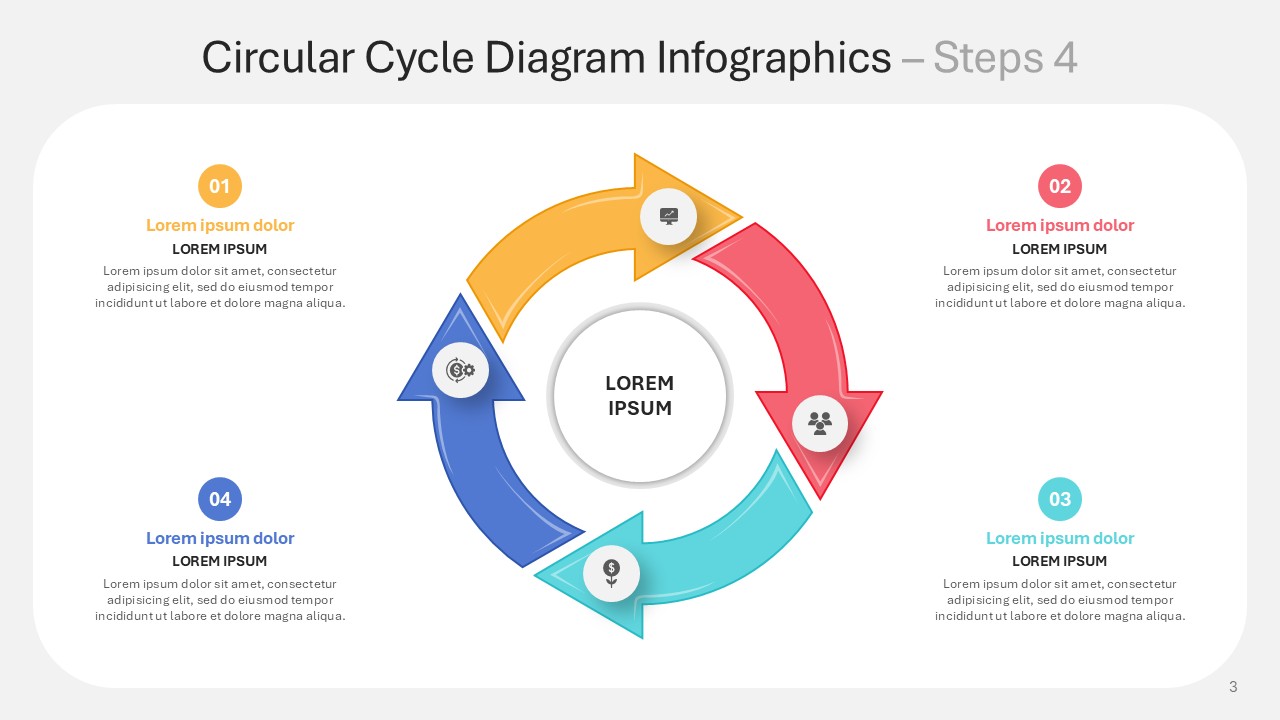
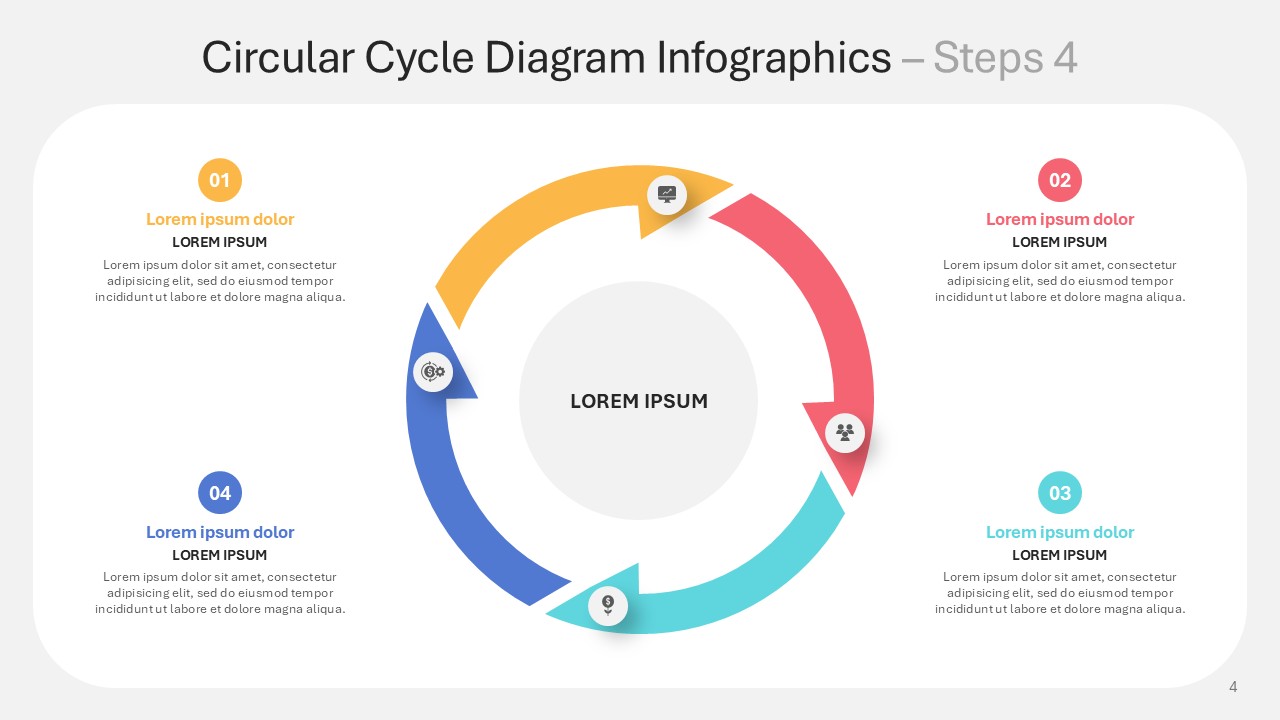
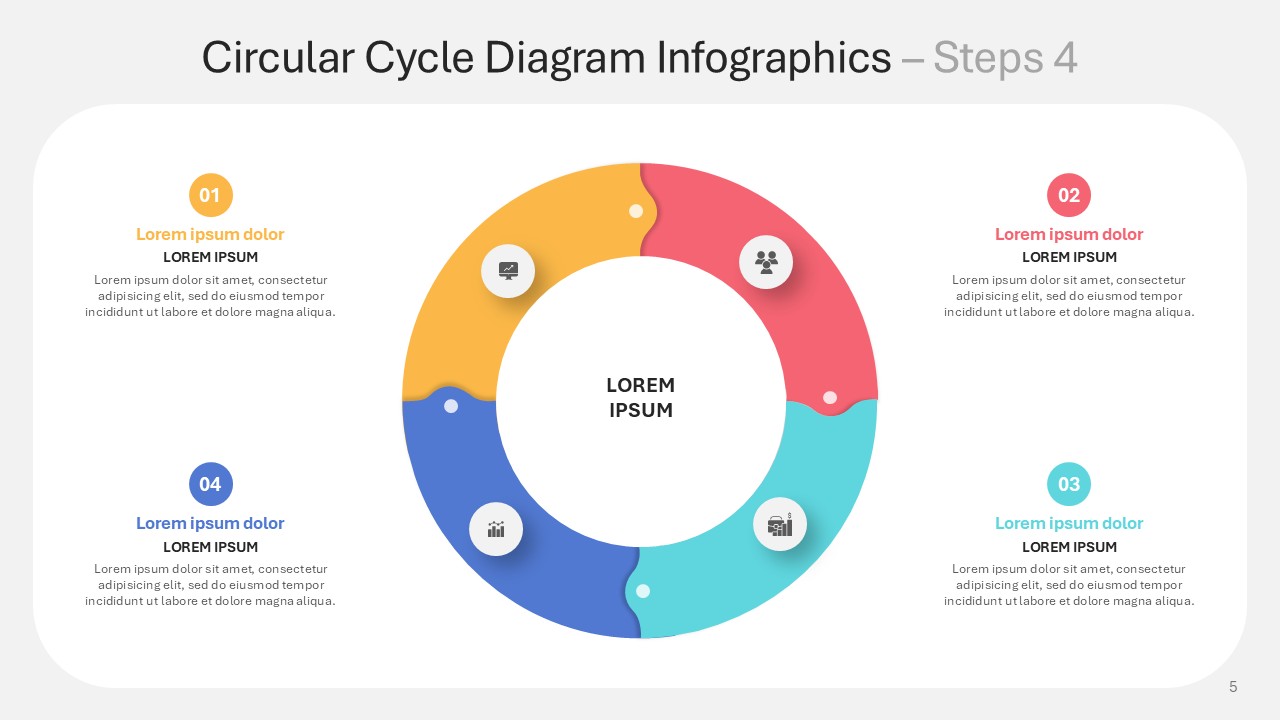
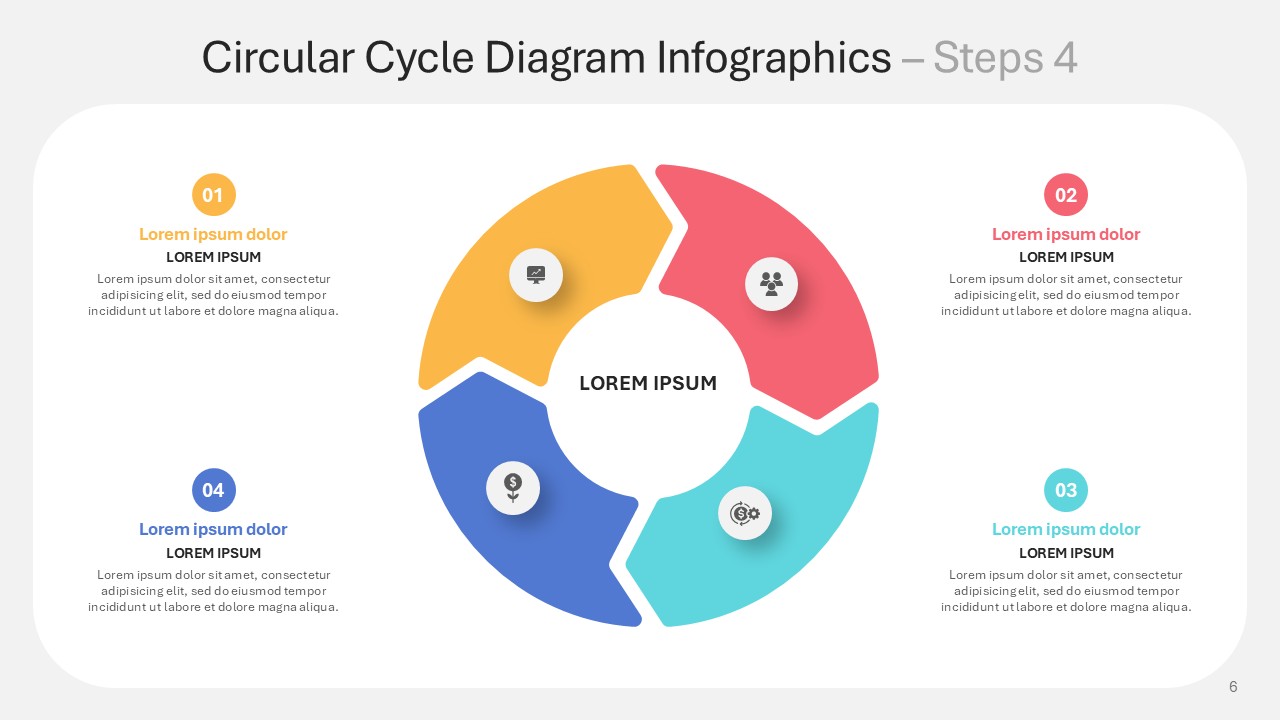
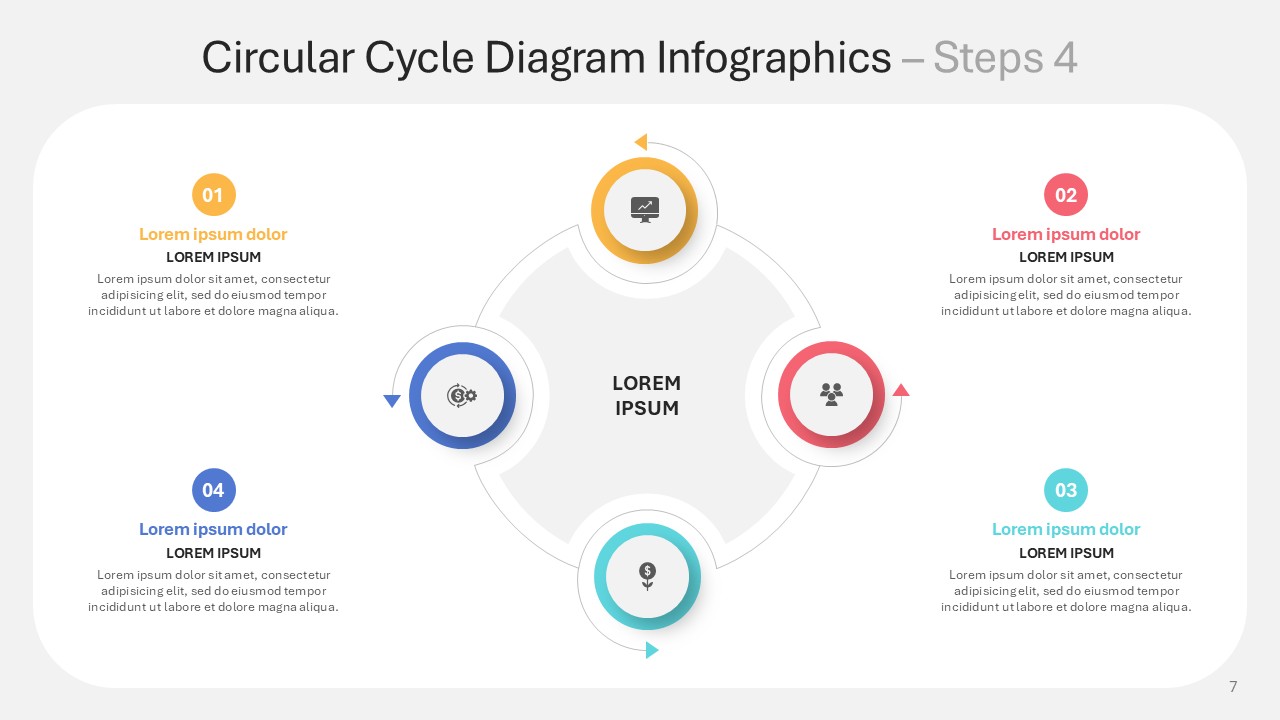
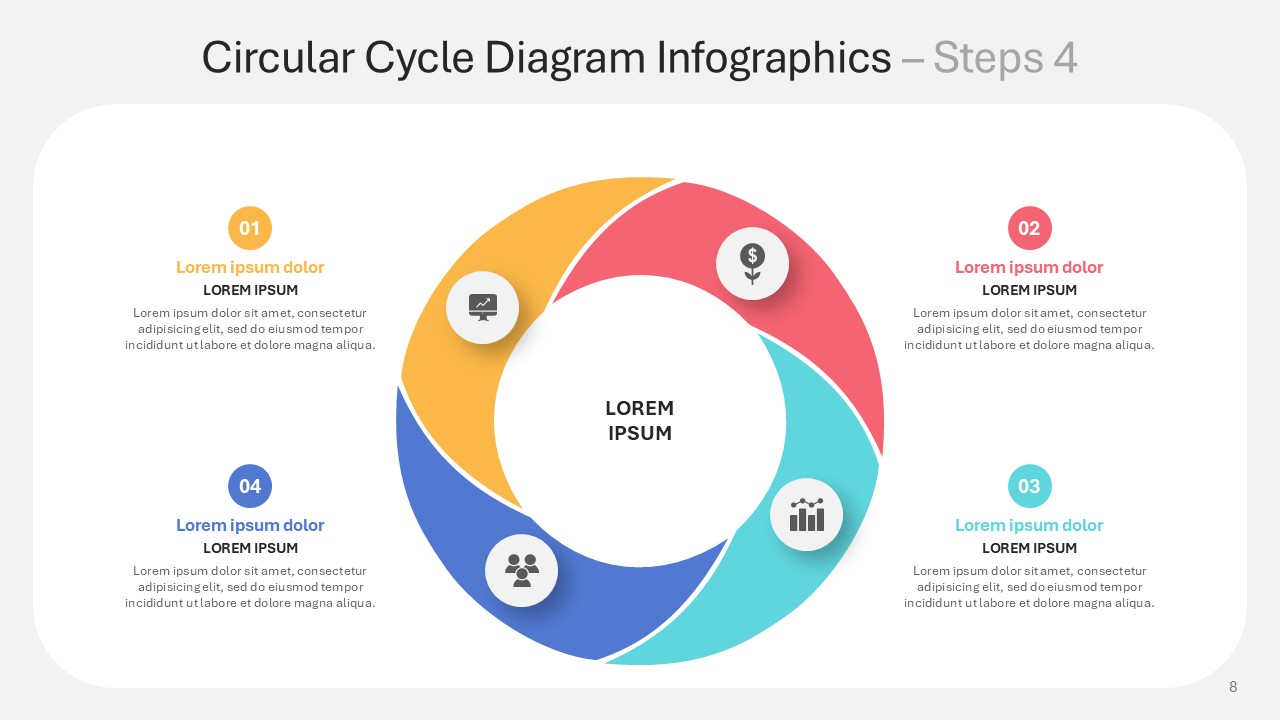
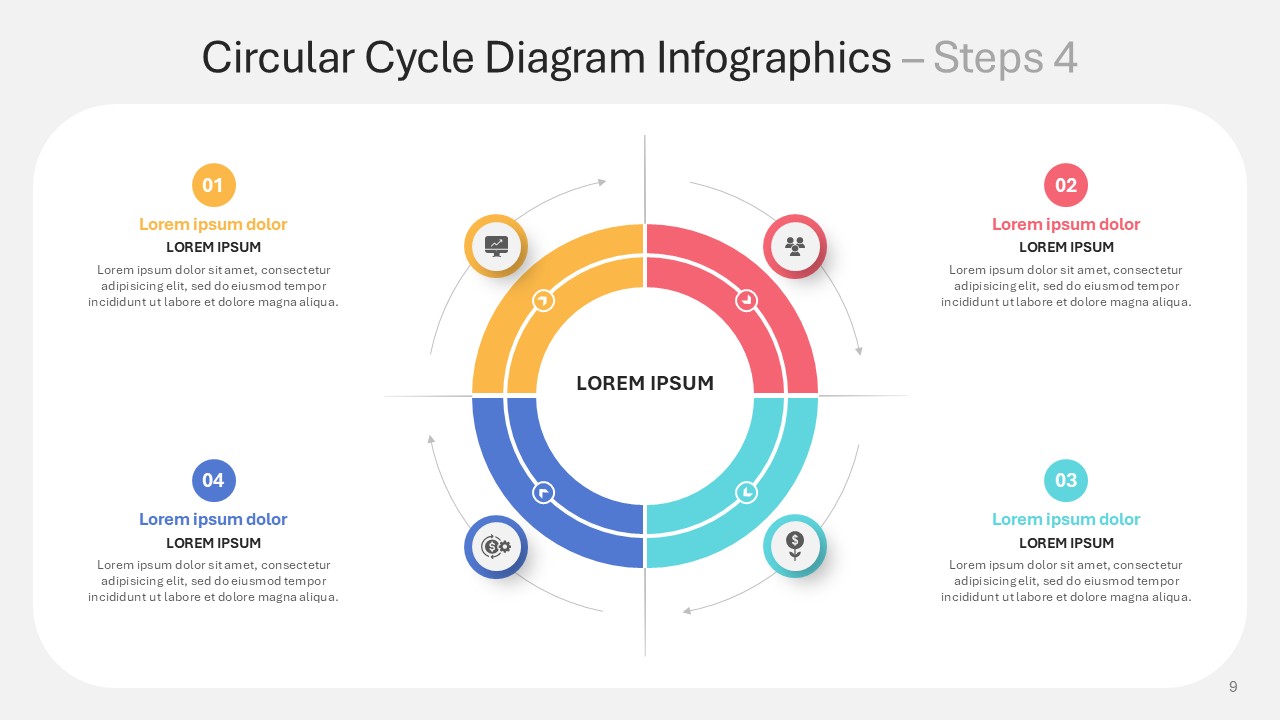
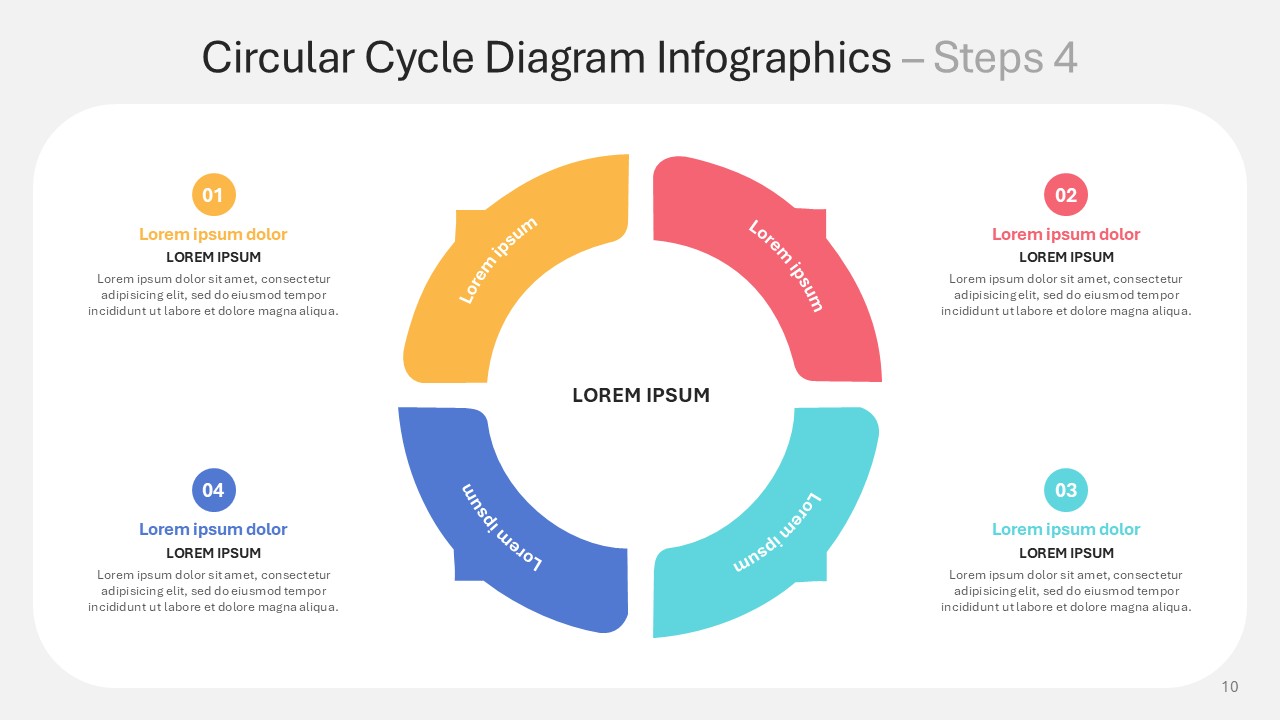
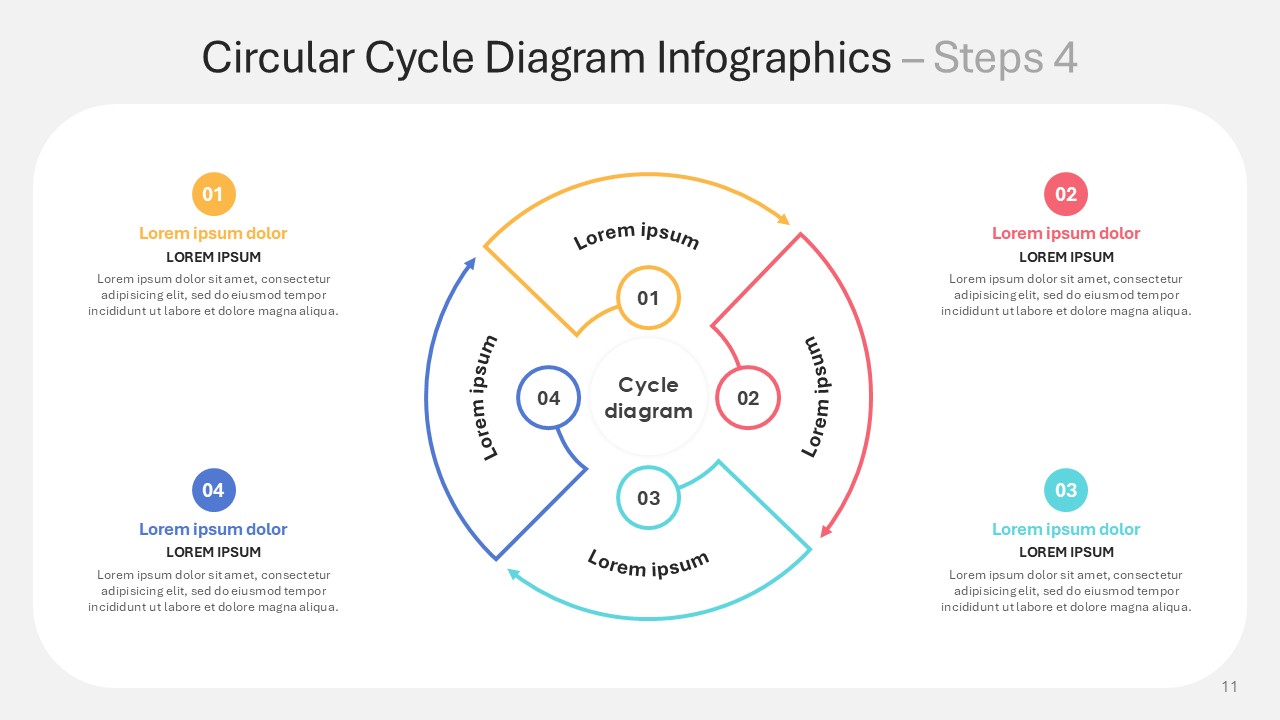
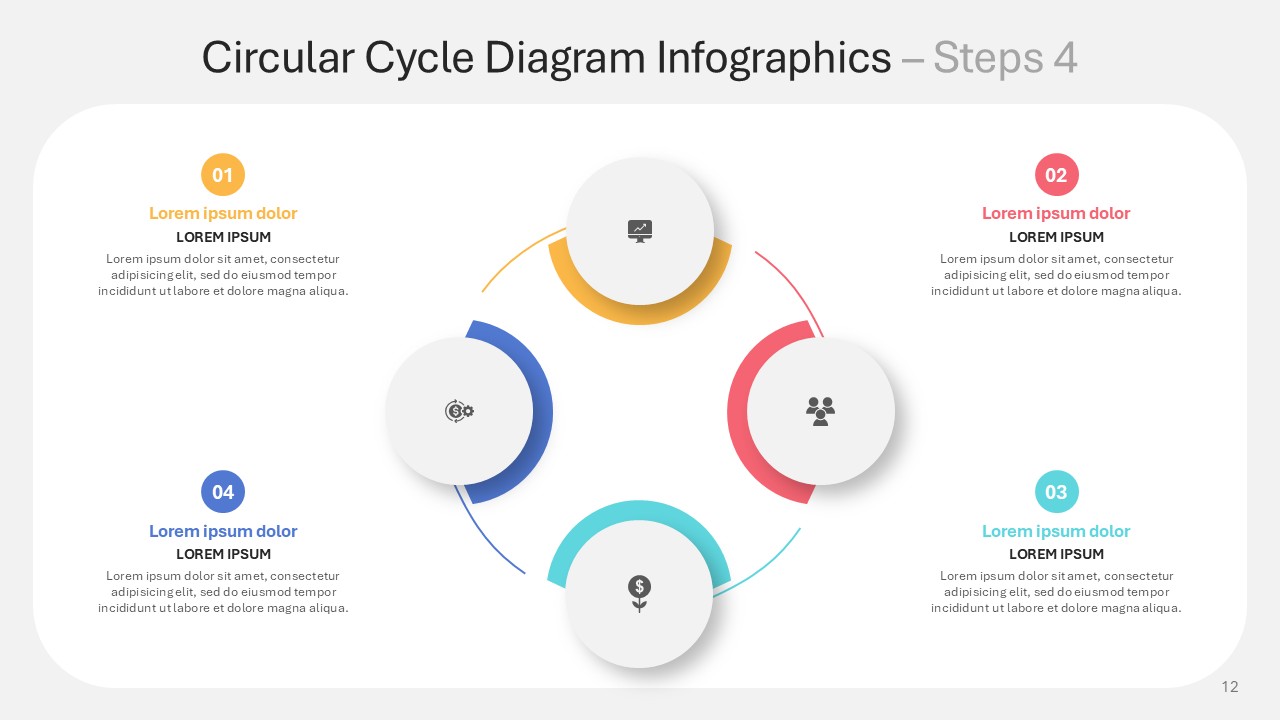
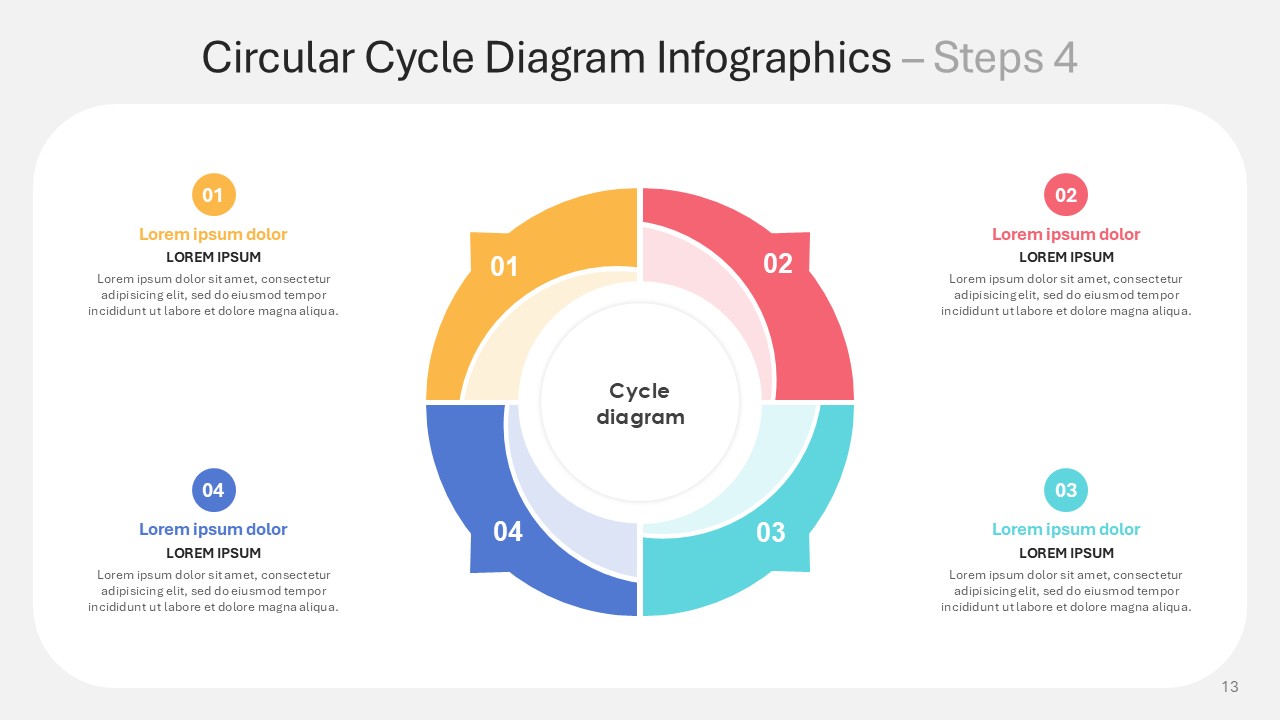
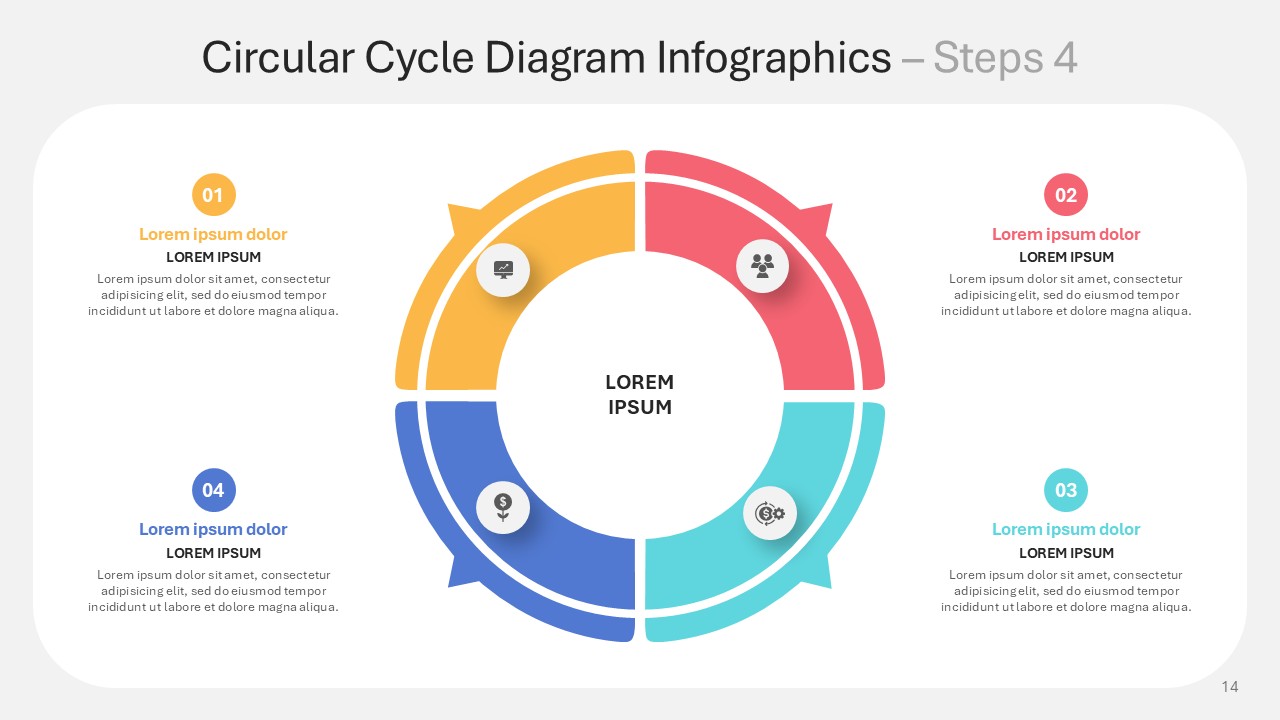
Quadrant geometry becomes a strategic lever in the Circular Cycle Diagram Steps 4 Infographics PPT Template, rendering complexity legible. Each slide subdivides the cycle into four critical phases: ignition (yellow), acceleration (red), integration (cyan), and maturation (blue). Animated gear motifs, quadrant-linked modules, and radial progression bars illustrate phenomena as divergent as agile sprint retros and Kaizen micro-cycles. The layout excels in contexts where traditional linear plots stall, endowing recursive workflows with both kinetic unity and irrevocable closure.
Embed your narrative within this scaffold using PowerPoint or Google Slides. Replace guide images with proprietary symbols, adjust segment colors to resonate with your brand palette, or stretch/constrict phases to spotlight key emergences. The Circular Cycle Diagram: Steps 4 Infographics PowerPoint Template contains adaptable variants for PDCA loops, expanding flywheels, and circular-economy phases—all modifiable without graphic-training encumbrance.
Designed for operations executives illustrating resilient supply flows, marketing strategists plotting campaign continuums, sustainability directors quantifying circular flows, and educators presenting biological or engineered circuits. The Circular Cycle Diagram: Steps 4 Infographics PowerPoint Template distills recurring complexity into elegant clarity, serving retrospective sessions, ISO compliance records, and investor briefings where recurring processes invite repeatable, refined visual framing.
Access the Circular Cycle Diagram Steps 4 Infographics PowerPoint Template to reshape disjointed processes into cohesive visual loops. Where traditional slides lose dynamism, this interactive framework converts intricacies into clear, actionable flow that teams own and leaders advocate.
Template Specifications
Name: | Circular Cycle Diagram Steps 4 Infographics PPT Template |
Quantity: | 15 slides |
Ratio: | 16:9 |
Colors : | |
Rating: | Premium |
Tutorials: | Click Here to View More |
SlidesBrain offers presentation features that allow you to customize every aspect of your slides. This means you can modify text, images, colors, fonts, and icons to your liking. Additionally, adjusting graphs in PowerPoint is simple, enabling you to change colors, numbers, and labels to match your preferences and create the perfect presentation.
Looking for a slide or PPT that’s uniquely yours? Our presentation design agency is here to help make your ideas a reality. As a leading presentation design company, we focus on delivering premium-grade bespoke presentations that engage your audience and ensure message retention. Kindly get in touch with us for professional custom presentation design services and transform your brand’s message for the purpose that you have in mind.
Premium Template
Unlock this template and gain unlimited access
Template Specifications
Dimensions
15 Slides, 1366 x 768 pixels – 16:9 Aspect Ratio (HD Presentation Quality)
Format
Download as a PPT to share with your recipient or generate a shareable link for online sharing.
Customizable
This template can be fully customized. You can edit content, change image(s), apply custom colors, input your own fonts and logo, and more.
Related tags
Related Presentations
No related products found.
-
basic shapes
Cybersecurity Trends Infographics PowerPoint Template
Rated 0 out of 5basic shapes | 7 slides 16:9 -
basic shapes
Cybersecurity Statistics Infographics PowerPoint Template
Rated 0 out of 5basic shapes | 8 slides 16:9 -
blue
Circular Cycle Diagram Steps 6 Infographics PPT Template
Rated 0 out of 5business | 13 slides 16:9 -
blue
Circular Cycle Diagram Steps 5 Infographics PPT Template
Rated 0 out of 5business | 12 slides 16:9 -
blue
Circular Cycle Diagram Steps 4 Infographics PPT Template
Rated 0 out of 5business | 15 slides 16:9 -
business
Circular Cycle Diagram Steps 3 Infographics PPT Template
Rated 0 out of 5business | 11 slides 16:9
Related products
-
blue
Winning Social Media Strategy One Pager Editable PPT Template
Rated 0 out of 5Growth Stage Deck | 1 slides 16:9 -
business
Pillars of Continual Improvement Infographics Presentation
Rated 0 out of 5business | 7 slides 16:9 -
Business
Online Medical Consultation Presentation Templates
Rated 0 out of 5Business | 18 slides 16:9 -
Color
Happy Diwali Festival Presentation Template
Rated 0 out of 5Free PowerPoint Templates | 21 slides 16:9 -
black
Back To School Template for PowerPoint and Google Slides
Rated 0 out of 5education | 19 slides 16:9
Customer Reviews
“A review from a customer who benefited from your product. Reviews can be a highly effective way of establishing credibility and increasing your company's reputation.”
Customer Name
“A review from a customer who benefited from your product. Reviews can be a highly effective way of establishing credibility and increasing your company's reputation.”
Customer Name