Big Data Analytics Steps 4 to 8 PowerPoint Infographics
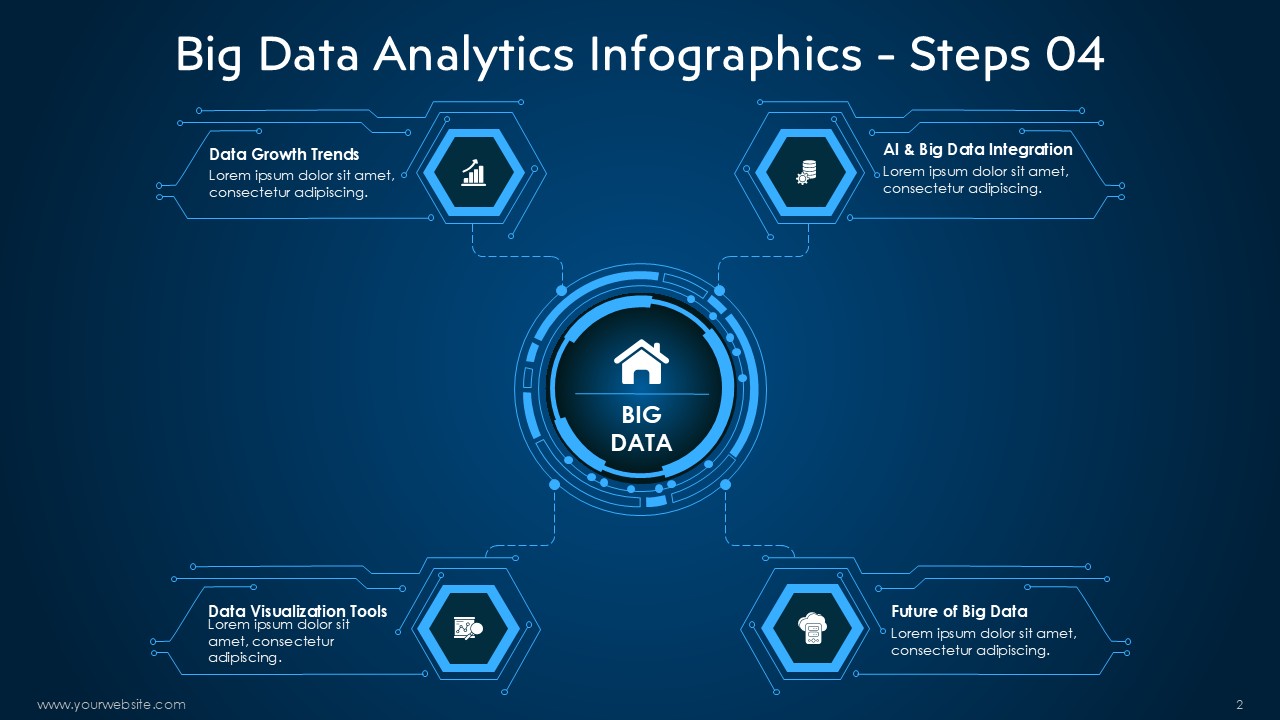
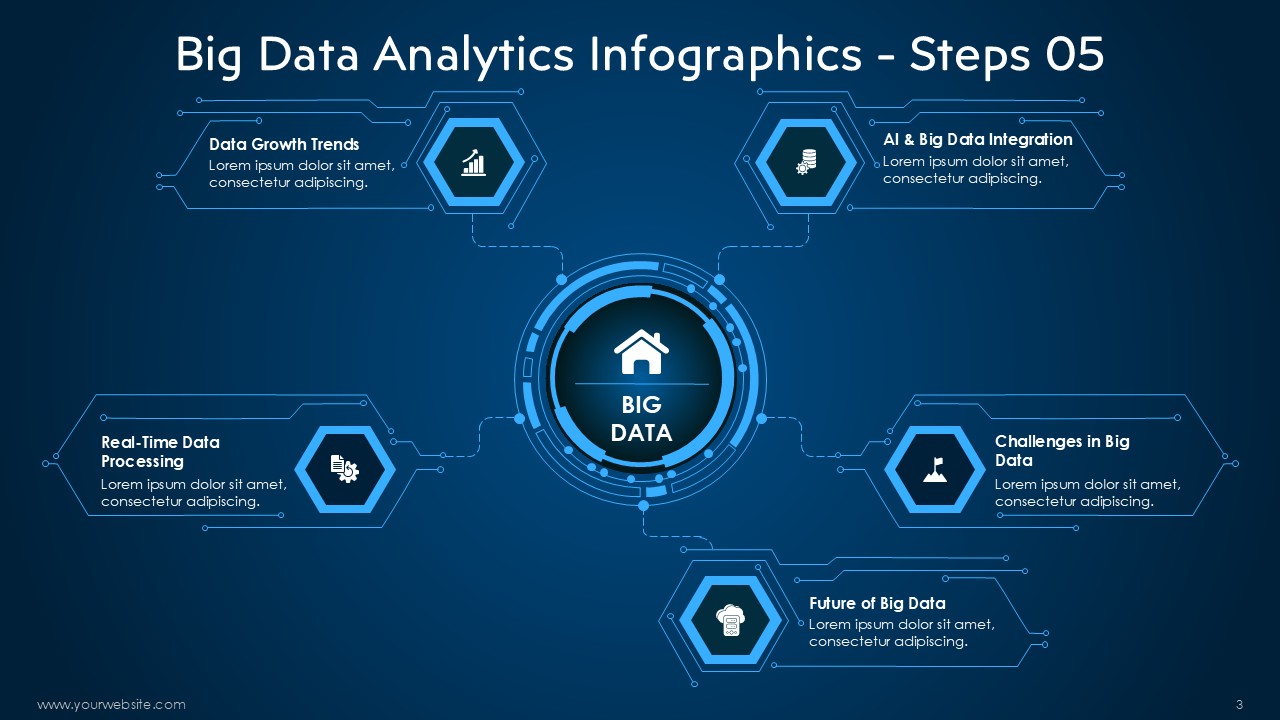
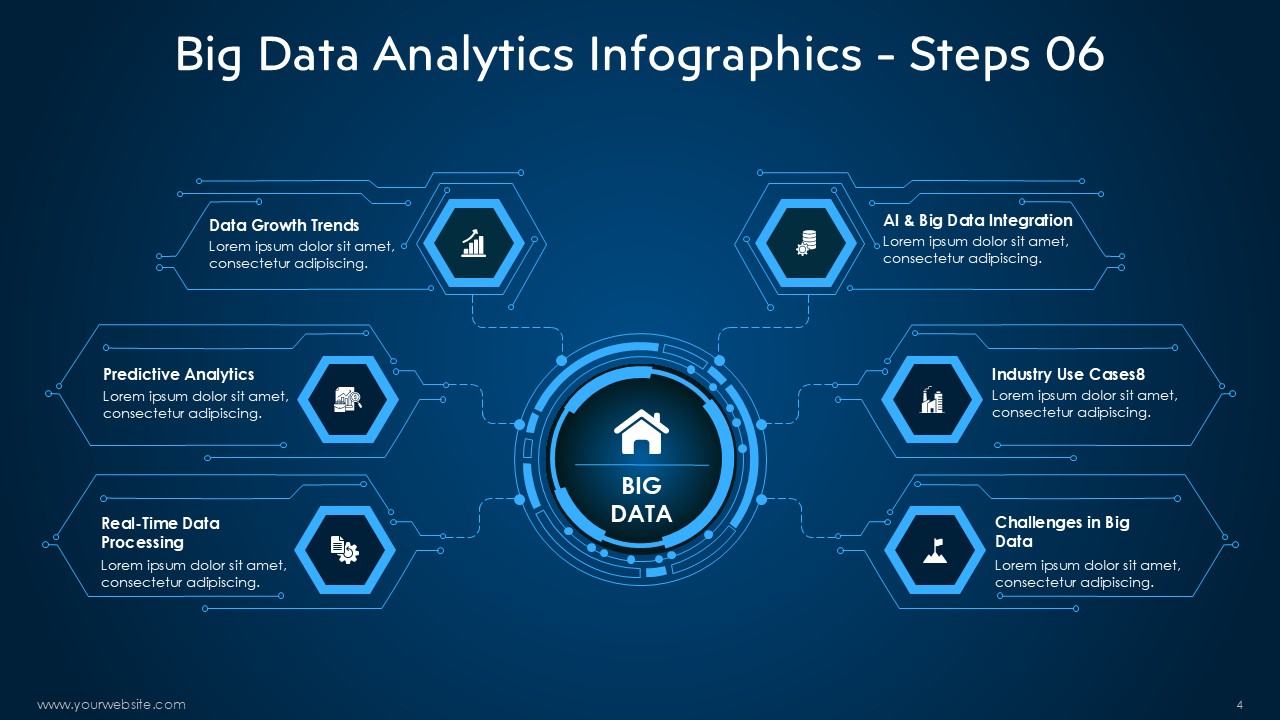
The Big Data Analytics Steps 4 to 8 template offers a concise and eye-catching overview of the middle stages of the big-data workflow. Spanning seven slides, it converts dense technical material into diagrams and visuals that are easy to follow, even for those new to the subject. Aimed at data analysts, educators, and project leads, the resource pairs a contemporary design with carefully arranged layouts that walk viewers through data modelling, analysis, interpretation, validation, and the generation of actionable insights.
Visual clarity is the template’s main strength. Customisable charts, flow maps, and set-of-icons illustrations break each step into manageable parts. Slides clearly outline vital tasks—from selecting a machine-learning algorithm and running statistical tests to checking data quality and framing business decisions—while the restrained colour palette and consistent typeface enhance legibility. As a result, the slides work equally well in boardroom briefings, university seminars, or meetings with external clients.
Since the Big Data Analytics Steps 4 to 8 template is fully editable in both PowerPoint and Google Slides, presenters can easily insert their own numbers, logos, and colour codes. This flexibility cuts design time drastically and guarantees that every deck looks polished. Whether your focus is on predictive models, machine-learning workflows, or broader data-driven initiatives, the template streamlines communication without sacrificing professionalism.
Whether you are preparing for a technology summit, a departmental workshop, or a presentation to senior stakeholders, these infographics serve as an effective translation of numbers into narrative. By integrating well-designed visuals into your analytics deck, you can elevate the professionalism of your material while still preserving the technical integrity of the underlying data. The resource is available for immediate download, allowing you to seamlessly incorporate it into your workflow and present sophisticated ideas in a manner that keeps the audience engaged yet informed.
Template Specifications
| Name: | Big Data Analytics Steps 4 to 8 PowerPoint Infographics |
| Quantity: | 7 slides |
| Ratio: | 16:9 |
| Colors : | |
| Rating: | Premium |
| Tutorials: | Click Here to View More |
SlidesBrain offers presentation features that allow you to customize every aspect of your slides. This means you can modify text, images, colors, fonts, and icons to your liking. Additionally, adjusting graphs in PowerPoint is simple, enabling you to change colors, numbers, and labels to match your preferences and create the perfect presentation.
Looking for a unique slide or PPT? We offer ready-to-use Google Slides and PowerPoint Templates, along with custom presentation design services, to help you present your ideas clearly and professionally. Get in touch with us for a presentation tailored to your purpose.
Premium Template
Unlock this template and gain unlimited access
Template Specifications
Dimensions
15 Slides, 1366 x 768 pixels – 16:9 Aspect Ratio (HD Presentation Quality)
Format
Download as a PPT to share with your recipient or generate a shareable link for online sharing.
Customizable
This template can be fully customized. You can edit content, change image(s), apply custom colors, input your own fonts and logo, and more.
Related tags
Related Presentations
No related products found.
-
agenda
Editable 365 Days Calendar 2029 Planner PPT Template and Google Slides
Rated 0 out of 5agenda | 14 slides 16:9 -
agenda
Editable 365 Days Calendar 2028 Planner PPT Template and Google Slides
Rated 0 out of 5agenda | 15 slides 16:9 -
agenda
Editable 365 Days Calendar 2027 Planner PPT Template and Google Slides
Rated 0 out of 5agenda | 11 slides 16:9 -
agenda
Editable 365 Days Calender 2026 Planner PPT Template and Google Slides
Rated 0 out of 5agenda | 13 slides 16:9 -
blue
SWOT Analysis for Business Infographics Fully Customizable PPTX and Google Slides
Rated 0 out of 5Frameworks | 17 slides 16:9 -
blue
Startup Success Pyramid Infographics Editable Presentation and Google Slides
Rated 0 out of 5Frameworks | 7 slides 16:9 -
blue
Progress Bar Infographics with Data Charts PPT and Google Slides
Rated 0 out of 5Charts | 13 slides 16:9 -
funnel
Learning Training Funnels Infographics PowerPoint Google Slides Theme
Rated 0 out of 5funnel | 6 slides 16:9
Related products
-
A4 Presentation Templates
Monthly Newsletter
Rated 0 out of 5A4 Presentation Templates | 4 slides 16:9 -
gray
Modern Quote PowerPoint Presentation Template and Google Slides
Rated 0 out of 5Infographics | 12 slides 16:9 -
brown
Free Global Financial Markets Overview PowerPoint Presentation
Rated 0 out of 5Free PowerPoint Templates | 21 slides 16:9 -
Business
Editable WhatsApp Web SWOT Analysis PowerPoint Template
Rated 0 out of 5Business | 11 slides 16:9 -
blue
Cost Reduction in Manufacturing Lean Automation and Waste Management Presentation Template
Rated 0 out of 5Business | 45 slides 16:9
Customer Reviews
“A review from a customer who benefited from your product. Reviews can be a highly effective way of establishing credibility and increasing your company's reputation.”
Customer Name
“A review from a customer who benefited from your product. Reviews can be a highly effective way of establishing credibility and increasing your company's reputation.”
Customer Name


MS Powerpoint


