Data Visualization
-
blue
Progress Bar Infographics with Data Charts PPT and Google Slides
Rated 0 out of 5Charts | 13 slides 16:9 -
Business
Gaming Industry Insights PPT Presentation Template
Rated 0 out of 5Business | 14 slides 16:9 -
basic shapes
Circle Infographics PPT PowerPoint Presentation
Rated 0 out of 5basic shapes | 7 slides 16:9 -
Artificial Intelligence PowerPoint Templates
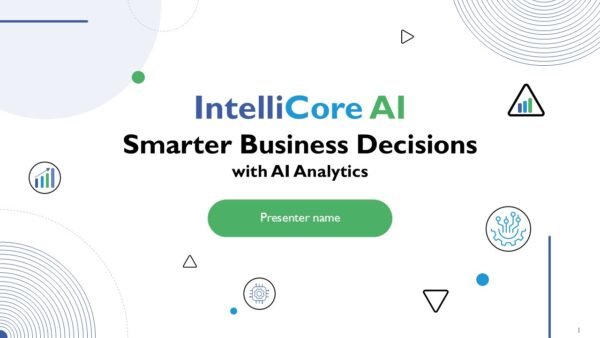
IntelliCore AI Driven Insights for Smarter Business Decisions Presentation Template
Rated 0 out of 5Artificial Intelligence PowerPoint Templates | 21 slides 16:9 -
Artificial Intelligence PowerPoint Templates
IntelliCore AI Business Intelligence and Predictive Analytics SaaS PPT Presentation Template
Rated 0 out of 5Artificial Intelligence PowerPoint Templates | 21 slides 16:9 -
Artificial Intelligence PowerPoint Templates
AI Powered Business Intelligence SaaS Platform PPT Presentation Template
Rated 0 out of 5Artificial Intelligence PowerPoint Templates | 26 slides 16:9 -
agenda
Circular Cycle Diagram Steps 7 Infographics PPT Presentation
Rated 0 out of 5agenda | 12 slides 16:9 -
agenda
12 Months Yearly Timeline Infographics PowerPoint PPT Template
Rated 0 out of 5agenda | 17 slides 16:9 -
blue
Circular Cycle Diagram Steps 6 Infographics PPT Template
Rated 0 out of 5business | 13 slides 16:9
Customer Reviews
★★★★★ Rated 5 out of 5
“A review from a customer who benefited from your product. Reviews can be a highly effective way of establishing credibility and increasing your company's reputation.”
Customer Name
★★★★★ Rated 5 out of 5
“A review from a customer who benefited from your product. Reviews can be a highly effective way of establishing credibility and increasing your company's reputation.”
Customer Name


