Top 7 Roadmap and Timeline Infographic Templates for PowerPoint

Every successful product launch, corporate strategy, or client pitch comes down to one thing: execution clarity. When you step in front of executives or investors to share multi-quarter goals, product milestones, or project phases, text-heavy slides lose the room instantly.
Visual roadmaps and timeline infographics solve that problem. They turn tangled schedules into clear, visual stories that hold attention and get everyone on the same page.
At SlidesBrain, we build flexible, professional PowerPoint templates made for real presenters. Whether you’re mapping out a software release, setting project milestones, or presenting a multi-year growth strategy, picking the right timeline layout makes all the difference.
Quick Comparison: Find the Right Timeline Template
Template Name | Primary Style | Best For | Key Framework Included |
1. Historical Timeline Infographics | Vertical block timeline | Company milestones & historical overview | Chronological event path |
2. Project Roadmaps Minimal Template | Modern corporate deck layout | Executive proposals & strategic planning | Multi-slide project overview |
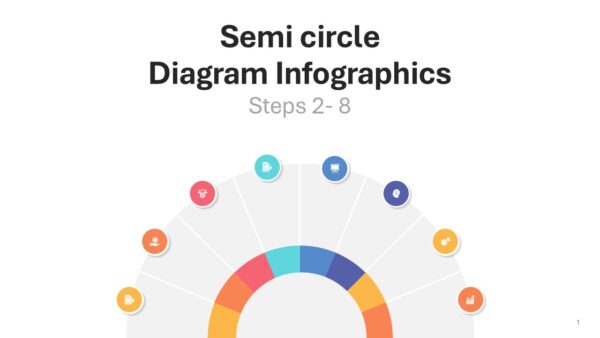
3. Semi Circle Diagram Infographics | Arch step diagram (Steps 2–8) | Stage-based workflows & process mapping | Curved step-by-step arc |
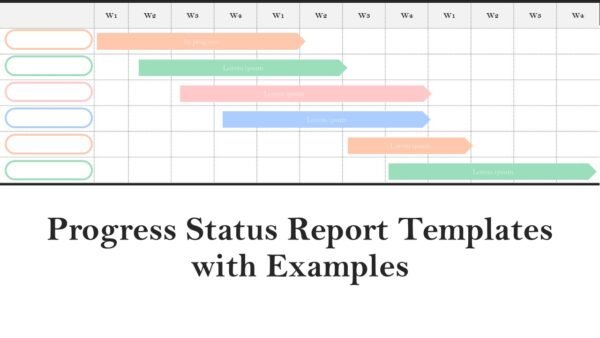
4. Progress Status Report Templates | Gantt-style monthly schedule | Operations & monthly status updates | Task timeline vs. project phase tracker |
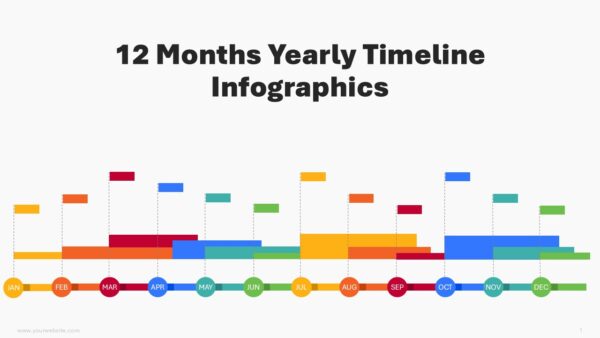
5. 12 Months Yearly Timeline Infographics | Annual flag & bar schedule | Annual planning & marketing roadmaps | Month-by-month milestone chart |
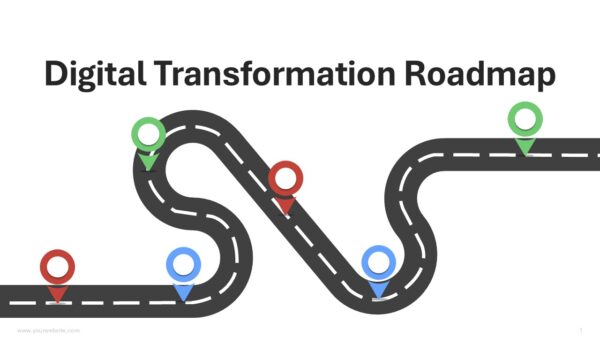
6. Digital Transformation Roadmap | Winding road path infographic | Tech adoption & change management | Multi-pillar digital strategy path |
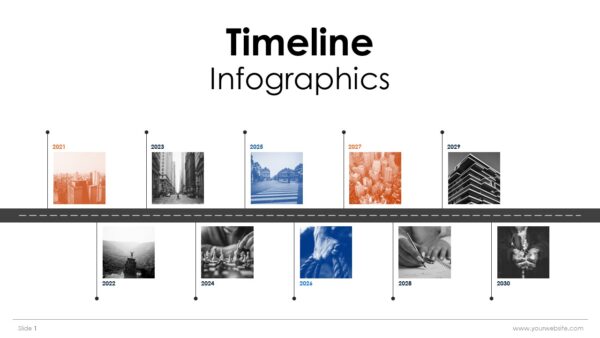
7. Modern Timeline Infographics | Minimal photo & year node deck | Executive briefings & key milestones | Clean photo-node timeline axis |
Here are the Top 7 Roadmap and Timeline Infographic Templates for PowerPoint and Google Slides
-
blue
Progress Status Report Templates with Examples PPT and Google Slides
Rated 0 out of 5business | 11 slides 16:9 -
blue
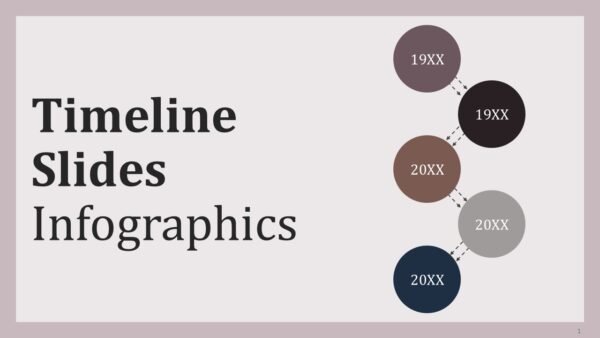
Timeline Slides Infographics PPT PowerPoint Presentation
Rated 0 out of 5business | 14 slides 16:9 -
agenda
Semi Circle Diagram Infographics Steps 2 to 8 Presentation
Rated 0 out of 5agenda | 9 slides 16:9 -
agenda
12 Months Yearly Timeline Infographics PowerPoint PPT Template
Rated 0 out of 5agenda | 17 slides 16:9 -
Arrows
Digital Transformation Roadmap Infographics PowerPoint Template
Rated 0 out of 5Arrows | 15 slides 16:9
A Reader's Guide: How to Select and Use These Templates in Your Presentations
Picking a timeline template is dependent upon your intended message and the audience in the room. While one linear format can be extensive for one message, multiple years of executive vision may require several formats to align with an agile process or to track deliverables for each team on a monthly basis.
Matching the Template to Your Story
- For Historical Context & Company Heritage: Vertical block structure templates (such as the Historical Timeline) can be used to showcase stakeholders sequential or phased changes, important milestones, achievements for the company, or even changes that occurred in the industry, without unnecessarily cluttering the template.
- For High-Stakes Proposals & Strategy Decks: When presenting to C-level executives, or to the client, using templates that have a clean overall design, structured agendas, and roadmaps for visions (such as the Project Roadmaps Minimal) can help maintain unity and visual consistency for the deck throughout all slides and in final proposal.
- For Step-by-Step Processes & Customer Journeys: Audience members can follow a connected and repeating process or path, even one that can be fluid, best with a curved-format template (such as the Semi-Circle Diagram).
- For Detailed Operational & Monthly Tracking: A task matrix layout (such as the Progress Status Report) can be used to track projects with a focus on major project phases, with a provided layout for project management, to help management quickly evaluate bandwidth and set due dates for project completion.
- Big-Picture Annual & Strategic Planning: To avoid information overload, break down 12-month or multi-year strategies and tech roll-out timelines using one of the following: horizontal milestone bars, flag markers, or winding path infographics (12 Months Yearly, Digital Transformation, or Modern Timelines, etc.).
Best Practices for Editing Timeline Slides
- Maintain Color Hierarchy: Include 2-3 main theme colors for milestone colors, whereas current status colors (i.e. In progress vs. Complete) may be different accent colors.
- Keep Text Scannable: Place the most relevant information in the graphic for ease of understanding. Avoid wordy explanations and/or KPIs, as there should be a limit to how much text is contained in callouts.
- Ensure Multi-Platform Compatibility: Each of the templates provided uses vector shapes and slide master layouts. Therefore, they can be edited with ease in Microsoft PowerPoint or Google Slides and retain all settings and formatting.
Simple Text Version: Quick Copy-Paste Timeline Outline
Looking for a simple text template for a quick draft of an email or project charter before working on a document? This may be helpful as you organize your slides:
Phase 1: Discovery & Planning (Month 1): Finalize market research and lock down the project charter to set the project scope and provide first draft wireframes.
Phase 2: Design & Prototyping (Months 2–3): Develop design system and interactive prototype to obtain signed off designs and technical specifications.
Phase 3: Development & QA (Months 4–5): Develop core product features and complete system testing for internal beta release.
Phase 4: Launch & Review (Month 6): Release the product and conduct user onboarding; create post release product performance report.
FAQs & Practical Guide on the Top Roadmap and Timeline Infographic Templates for PowerPoint and Google Slides
Are these templates fully compatible with PowerPoint and Google Slides?
Yes. Every template uses native vector shapes and standard slide master layouts. You can download .pptx files for PowerPoint or open them directly in Google Slides without losing formatting, custom fonts, or alignment.
Can I customize colors, fonts, and icons to match my company brand?
Yes. All design elements are fully editable. You can change fill colors, adjust typography, resize elements without quality loss, or swap vector icons using built-in shape tools.
How do I choose between a Horizontal, Vertical, or Circular layout?
- Horizontal Timeliness: Best for events that happen over equal intervals of time, such as days, months, or years, since audiences read from left to right.
- Vertical Timeliness: Best for long events or as a complement for a detailed list with alternating call outs of text.
- Circular and Arc Diagrams: Best for recurring or rotating processes and workflows that are not time bound to calendar events.
How many milestones should I include in one slide?
Each slide should contain 5 to 7 key events to maintain readability. For instances where you have a one year schedule that is particularly busy, you are allowed to group together some of the smaller events that happen over the course of that year and place them under a major check point that occurs over the course of the 4 quarters. You also have the ability to split the timeline over two slides.
What is the difference between a Gantt status report and a strategic map slide?
A Gantt status report provides the task breakdown, who is responsible for that task, and what the time related deadlines are over each of the various phases of the project. A strategic roadmap slide is a slide that eliminates the task related noise and focuses on executing the major project goals and achieving the key project delivery milestones.
Can I scale or add more steps/milestones to these slides?
Yes. For example, the Semi Circle Diagram Infographics template includes options for 2 to 8 distinct steps, and linear timeline bars can be duplicated or re-spaced along the axis to fit your specific timeframe or milestone count.