10 Best Infographic Templates for PowerPoint & Google Slides

10 Best Infographic Templates for PowerPoint & Google Slides

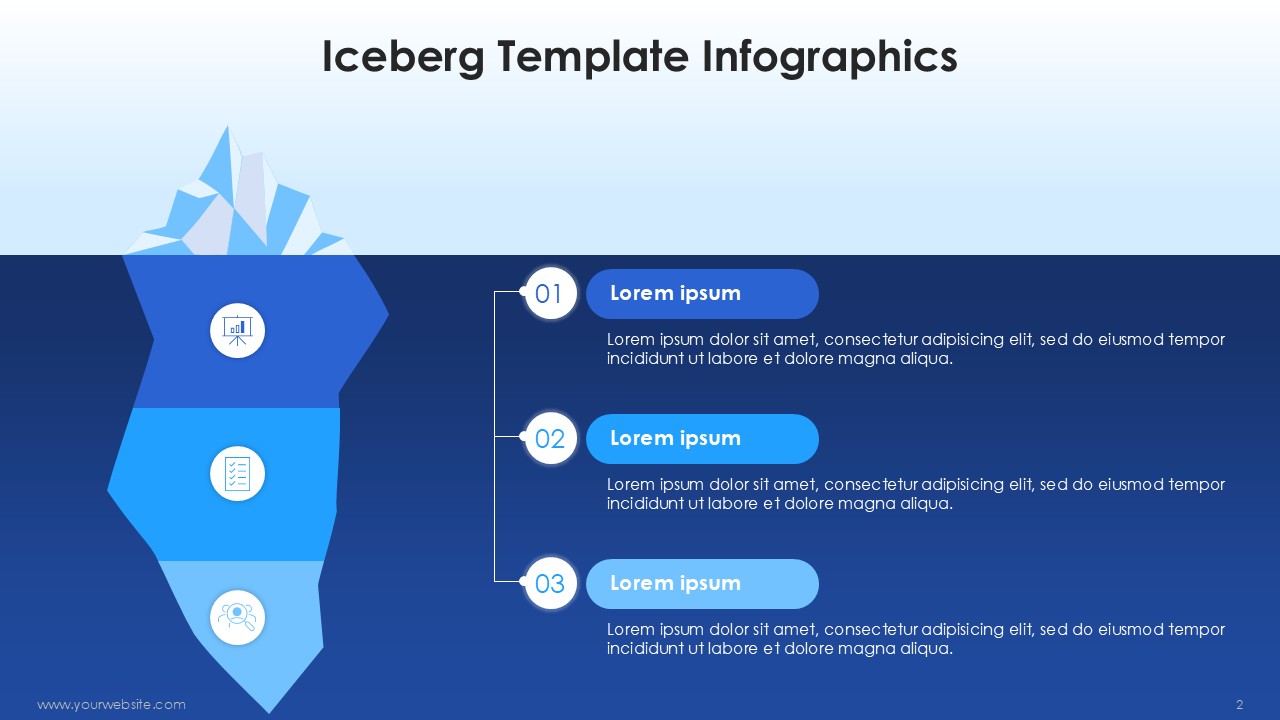
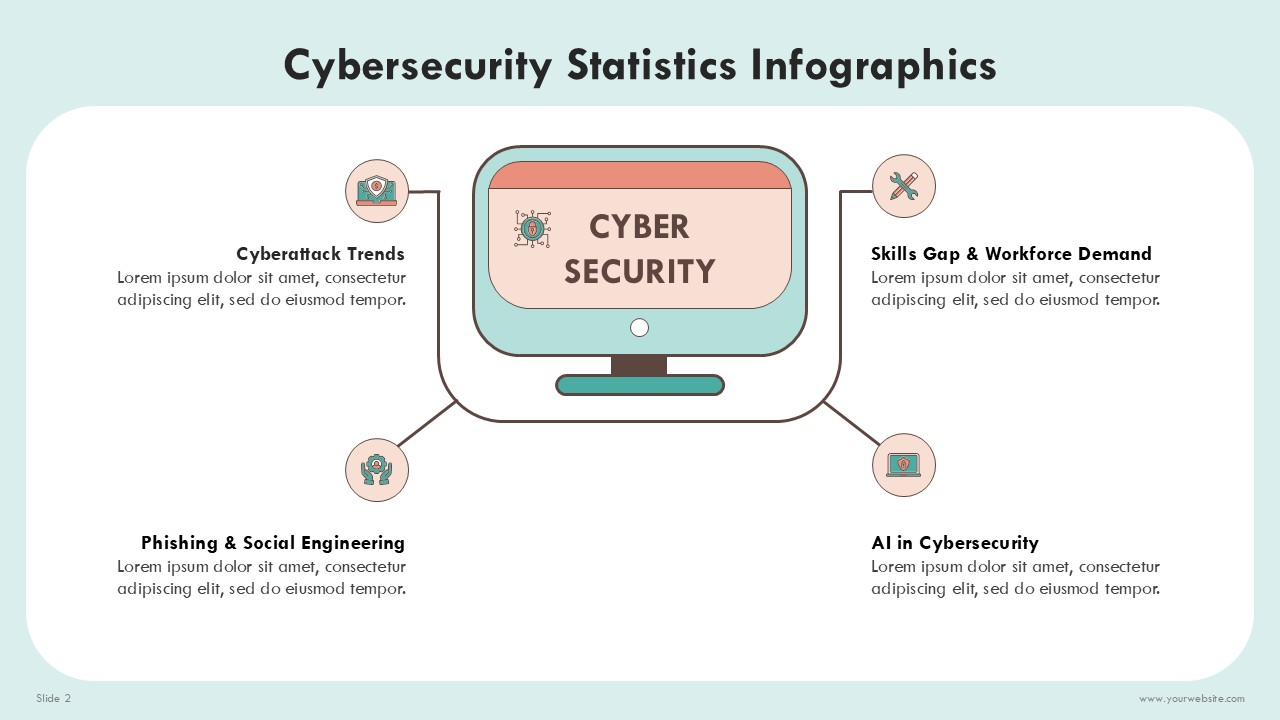
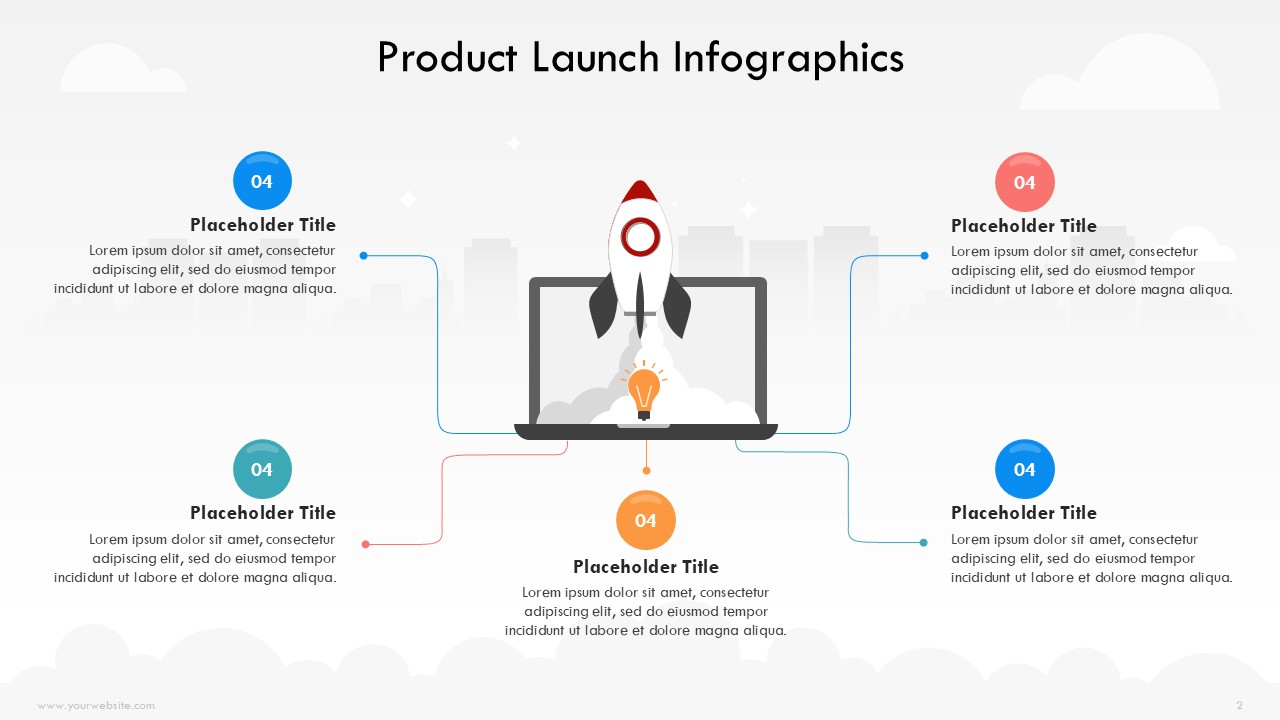
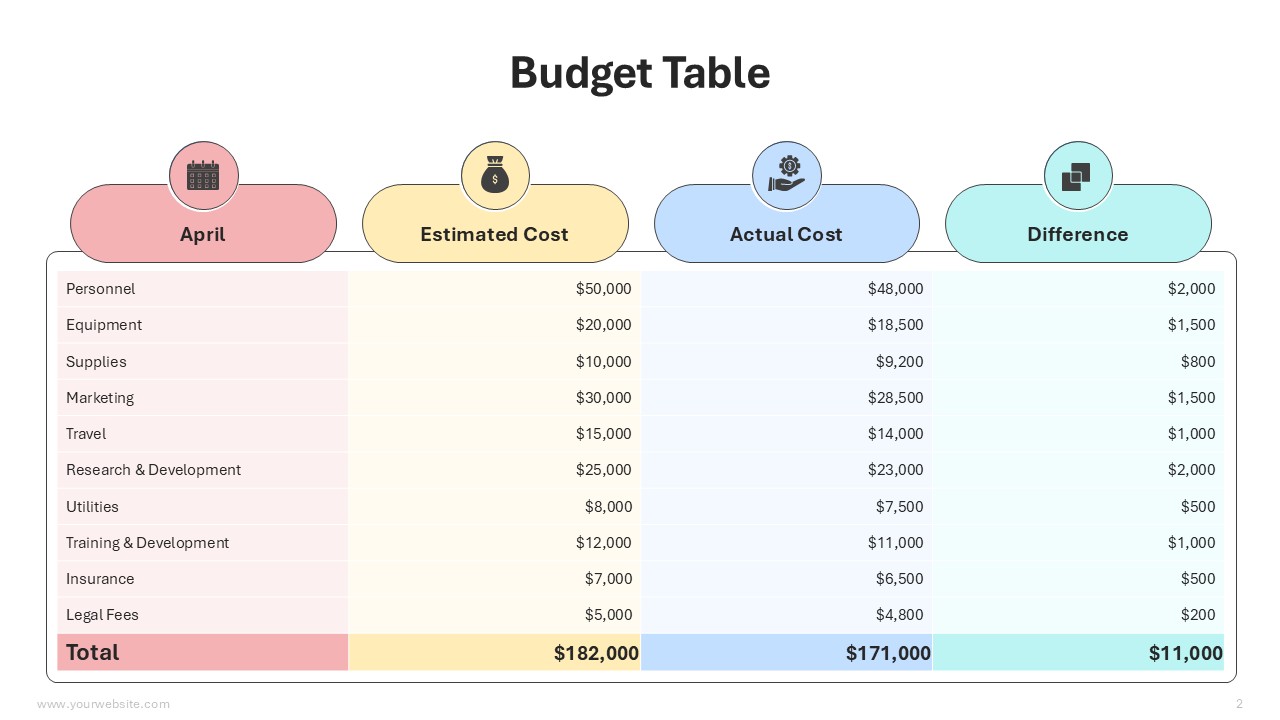
Clarity is crucial in today’s information-driven environment, where people have short attention spans. Whether in business meetings, classrooms, or internet presentations, audiences can quickly become overwhelmed by lengthy paragraphs and data-heavy slides. For this reason, infographics are now among the most effective communication tools. Infographic templates assist in converting difficult information into content that is visually appealing and simple to comprehend.

Google Slides and PowerPoint both provide accessibility and versatility, and with the correct infographic templates, you can produce polished images without having any design experience. The top ten infographic templates for Google Slides and PowerPoint are examined in this post, along with how each might improve your presentations.

Why Use Infographic Templates in Your Presentations?

Infographic templates are a smart move for anyone looking to transform dense data into a compelling visual story without the stress of starting from scratch. They act as a professional “shortcut,” providing a structured foundation that ensures your information is both readable and aesthetically pleasing

  • Simplify Complex Information: Infographics make data, procedures, and ideas easier to understand at a glance by using visual aids. Moreover, users can create aesthetic presentations that deliver their information clearly. 
  • Increase Audience Involvement: Compared to text-filled slides, visual storytelling draws in viewers and keeps them interested for longer. The integration of infographics and visual elements not only enhance audience attention, but also increases the odds of winning the business deals. 
  • Save Time: You may focus on the content instead of creating layouts from scratch thanks to pre-made templates. These infographic templates are ready to use, so users do not need to spend additional time on adding elements to make it impressive.
  • Boost Your Professionalism: Presentations look more professional and believable when they use uniform design, iconography, and color schemes. Moreover, the professional color hierarchy helps to keep your audience engaged for longer than expected.  

What Makes a Great Infographic Template?

Prior to delving into the list, it is imperative to highlight the essential components of an effective infographic template: 

Unambiguous visual hierarchy

Layouts that are easy to read

Regular color palettes

Modifiable forms and icons

Google Slides and PowerPoint compatibility

Design that is data-friendly

The Top 10 Infographic Templates for Google Slides and PowerPoint

Lets, take a deep dive to find the best infographics templates for Google Slides and PowerPoint

Iceberg Template Infographics PowerPoint Template

Using arrows, icons, and sections, this template offers a visual depiction of sequential procedures or workflows.

Ideal for:

Business procedures

Workflows for projects

Educational materials 

Cybersecurity Trends Infographics PowerPoint Template

This template is designed to present historical developments, events, or milestones in a chronological order. Moreover, companies can also use this template to highlight the key cybersecurity threads and trends that keep the business data secure in the future.

Ideal for:

Timelines for company growth

Project benchmarks

Presentations about history

Future Cybersecurity Trends

Product Launch Infographics PowerPoint Template

This style makes it easier to compare features, advantages, or data points side by side of the competitor’s product and your product.

Ideal for:

Comparisons of products

Analysis of before and after

Competitive analysis 

Budget Table Infographics PowerPoint Template

This template has a strong emphasis on visually appealing charts, graphs, and numerical insights to ensure business budgets stay aligned.

Ideal for:

Analytics and reports

Performance indicators

Results of the survey

Medical Infographics PowerPoint Template

It shows data in a hierarchical structure, medical concepts with visual elements, and  moving from basic components to high-level results.

Ideal for:

Frameworks for strategies

Acquiring model

Structures of medical organizations

Comparison Graph Infographics PowerPoint Template

It uses loops or segmented circles to depict circular processes or recurrent stages. This will also help to compare business plans, competitors strategies and lifecycle of your own business products.

Ideal for:

Life cycles of products

Models of continuous improvement 

Business comparison and future projections

Funnels for marketing 

Big Data Analytics Steps 4 to 8 PowerPoint Infographics

It uses geographic images and maps to communicate location-based information and data collected for business and organizations.

Ideal for:

Plans for market expansion

Analysis of demographics

International operations

Global Logistics Icons PowerPoint Infographics

It shows how a large group goes through several stages to focus on particular results in logistics.

Ideal for:

Funnels for sales

Travels of customers

Procedures for hiring

Cloud Technology Icons PowerPoint Infographics

It highlights key elements of cloud technology in an easy-to-scan format  by using icons and brief text . The template is easy to use and can be customized to meet the presentation goal.

Ideal for:

Important lessons

Advantages and characteristics

Slide summaries 

Strategic Business Roadmap Infographic PowerPoint Template

It is designed to graphically communicate future schedules, goals, and tactics. This is ideal for the business companies who want to highlight the business strategic plans to their teammates.

Ideal for:

Roadmaps for products

Strategies for business

Planning for growth

Which Is Better for Infographics: Google Slides or PowerPoint?

Infographic templates are effectively supported by both platforms:

Improved formatting options and offline accessibility are features of PowerPoint.

Cloud-based access and real-time collaboration are made possible via Google Slides.

Most modern infographic templates operate with both platforms, so users can choose according to their workflow and preferences.

Recommendations for Creating Powerful Infographics

For every slide, focus on a single main point.

Make use of clear graphics and succinct words.

Maintain a consistent use of typefaces and colors throughout

Use icons to bolster ideas

Ensure that charts are simple to understand.

Who Can Benefit from Infographic Templates?

Leaders and corporate professionals

Sales and marketing staff

Teachers and instructors

Researchers and academics

Analysts and consultants

Infographic templates let people communicate ideas more effectively and clearly.

Conclusion: Easy Visual Storytelling

Infographics turn facts into narratives that viewers can rapidly comprehend and recall. Without investing hours in design, you can produce visually striking presentations using the top ten infographic templates for PowerPoint and Google Slides.

Infographic templates let you communicate ideas clearly, effectively, and professionally whether you’re sharing insights, teaching concepts, or presenting corporate data.

Improve your visual communication by utilizing infographic templates right now.

SlidesBrain Custom Presentation Design Services

We provide professional presentation design services for startups and businesses. SlidesBrain offers some of the most competitive pricing online, starting at just $11.99 per slide. We deliver affordable, high-quality, investor-ready designs tailored to your needs.

If you’re looking for a clean, modern, and professional pitch deck, contact SlidesBrain today and let our expert designers bring your vision to life. Please Contact SlidesBrain today.

Shopping Cart