Comparison Graph Infographics PowerPoint Template
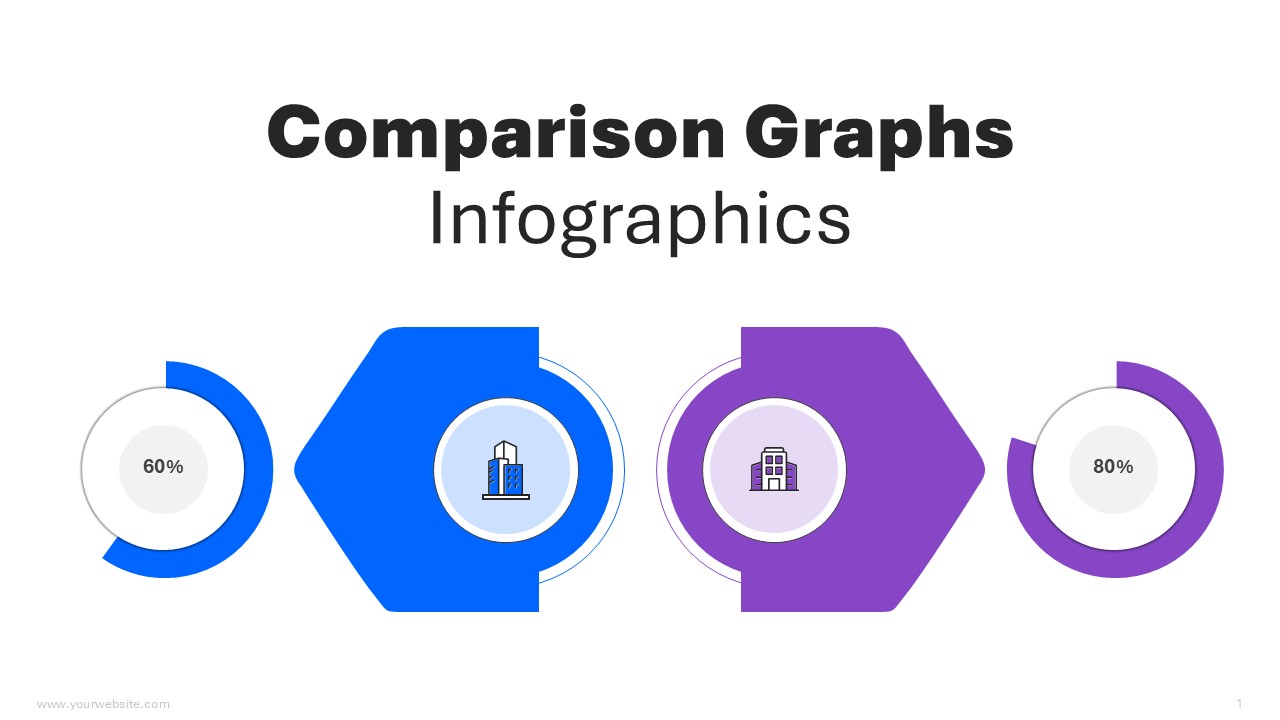
The Comparison Graph Infographics PowerPoint Template offers thirty-seven well-organized slides for anyone who needs to convey side-by-side data quickly and clearly. Sporting a contemporary blue-and-purple palette, the set commands attention without overshadowing the information, and each graphic is built to translate complicated numbers into straightforward visuals. Whether the setting is a corporate briefing, a classroom seminar, or a long-range planning meeting, the template equips you to turn raw statistics into persuasive stories listeners can grasp at a glance.
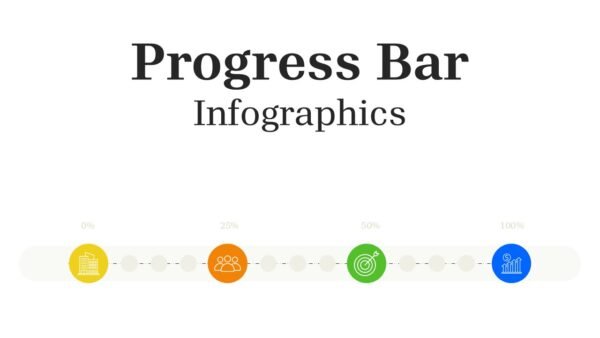
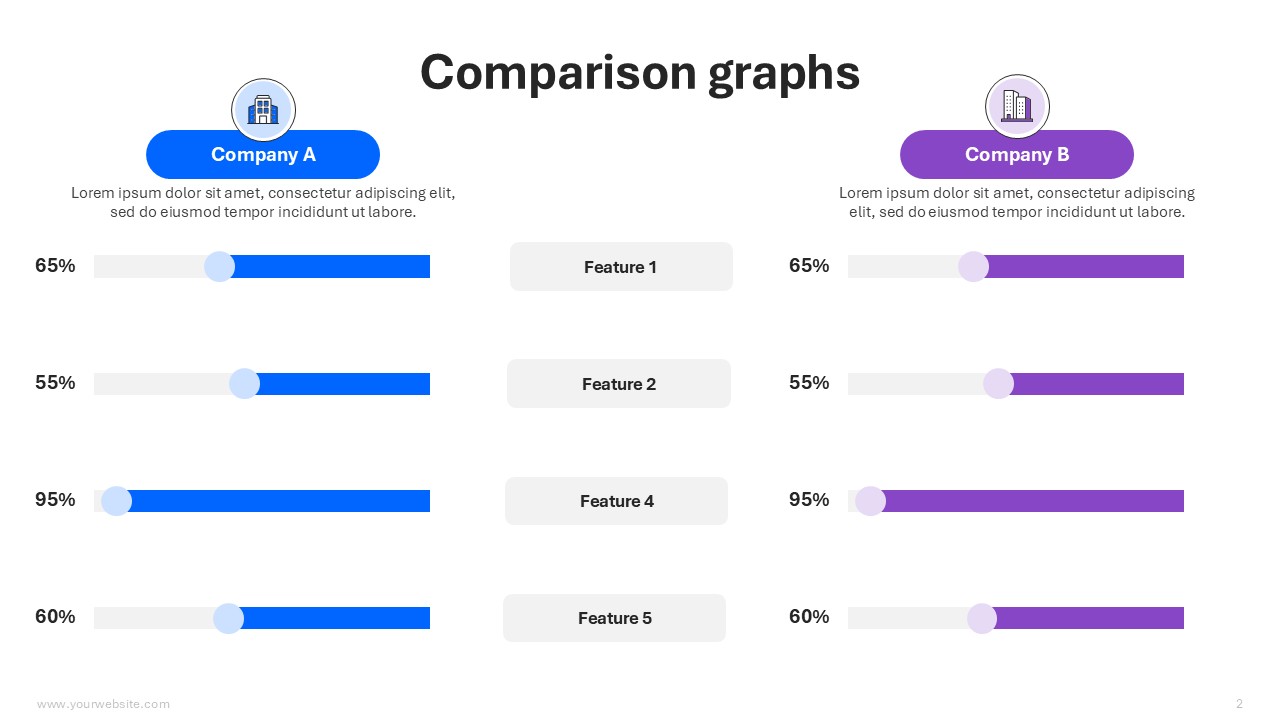
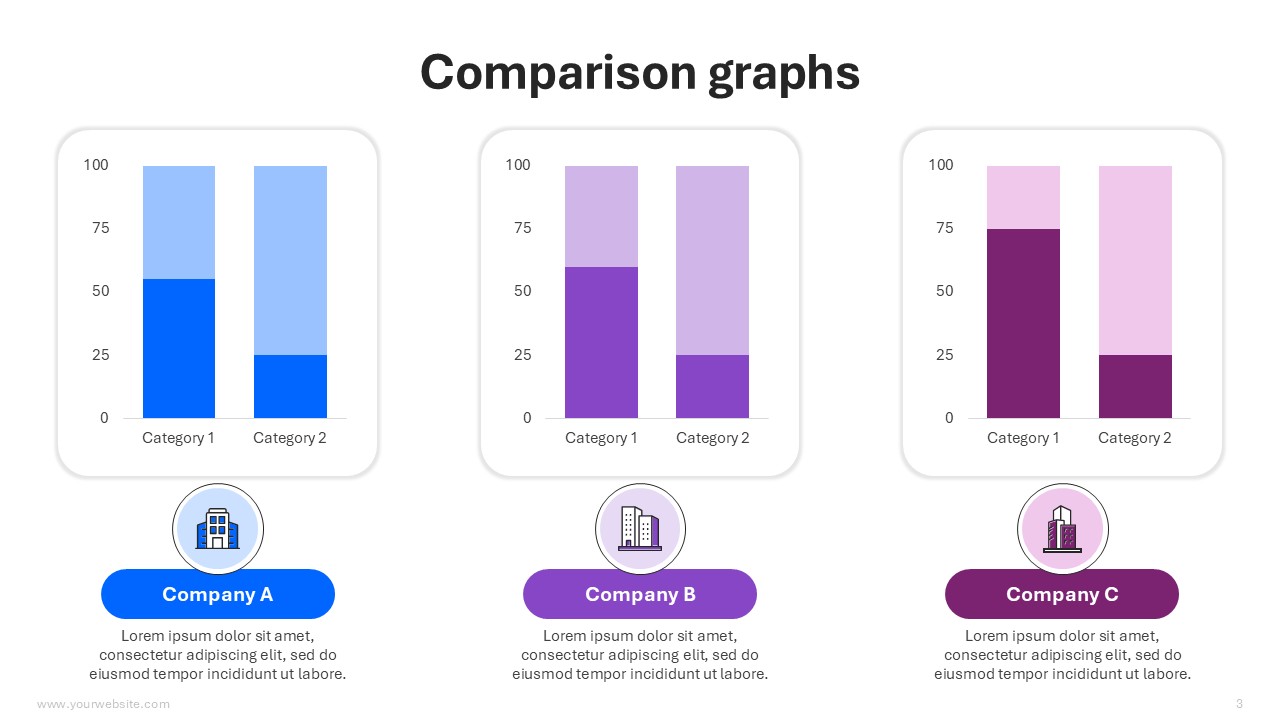
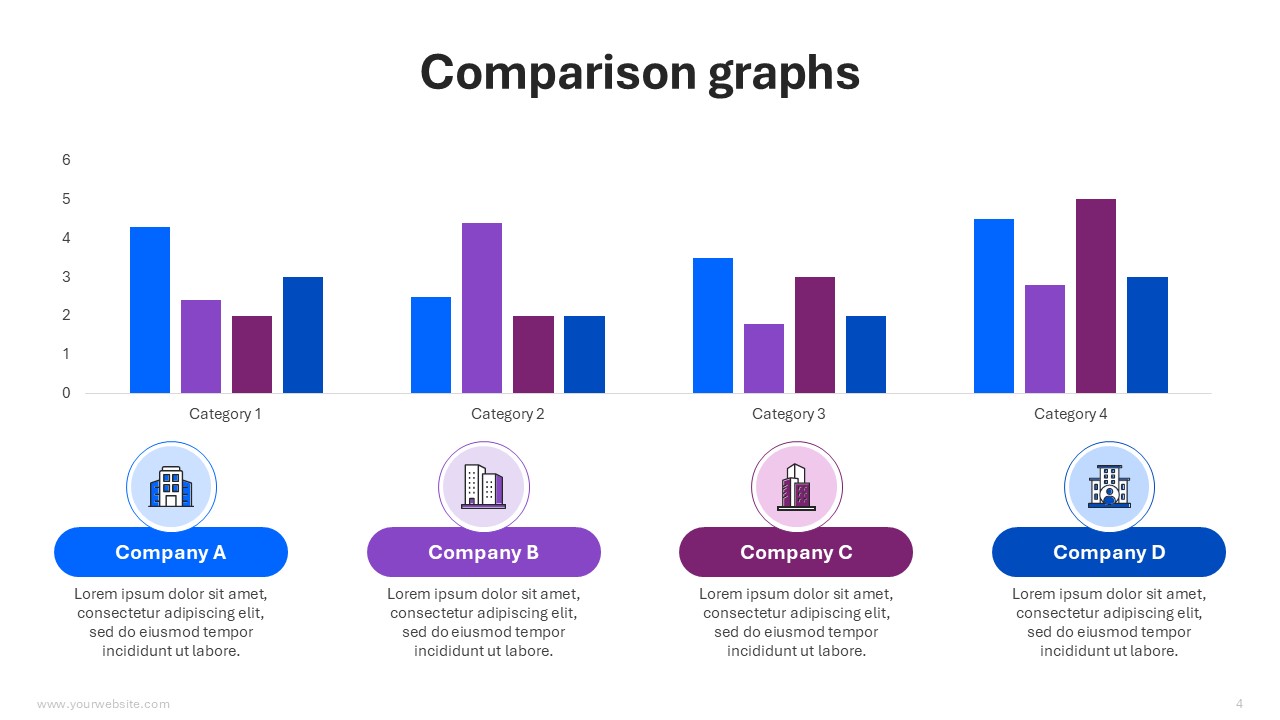
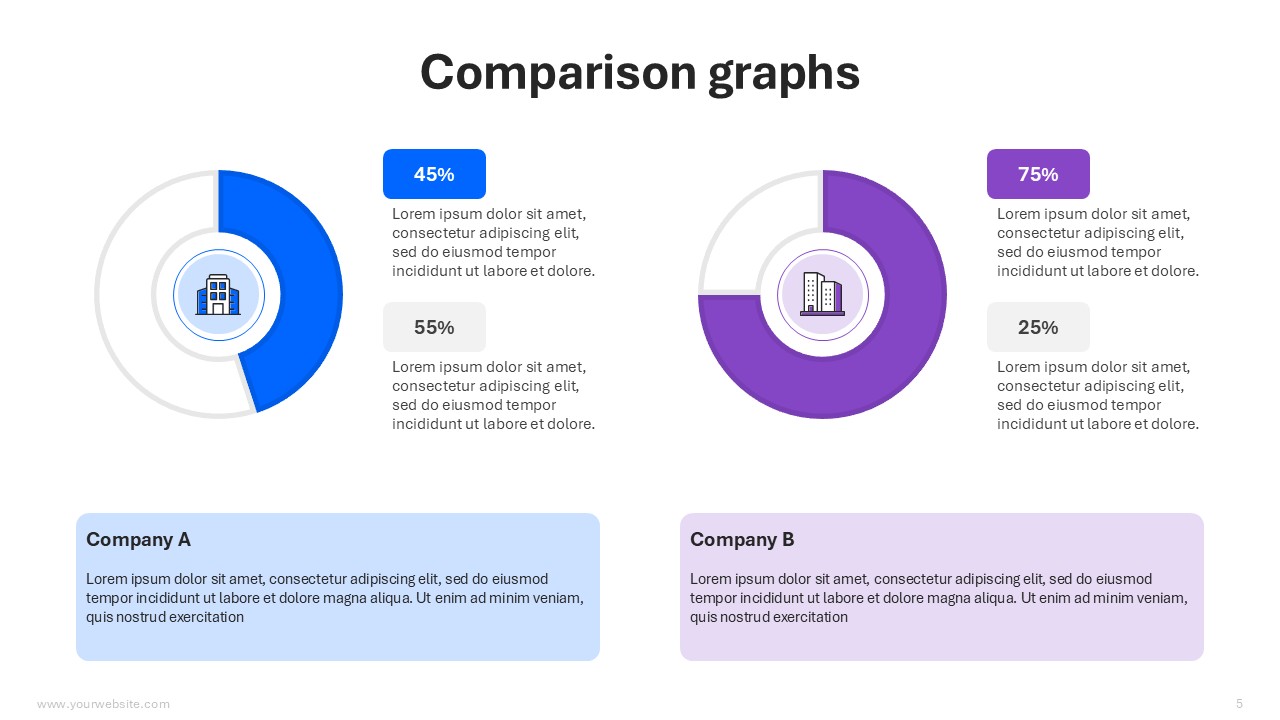
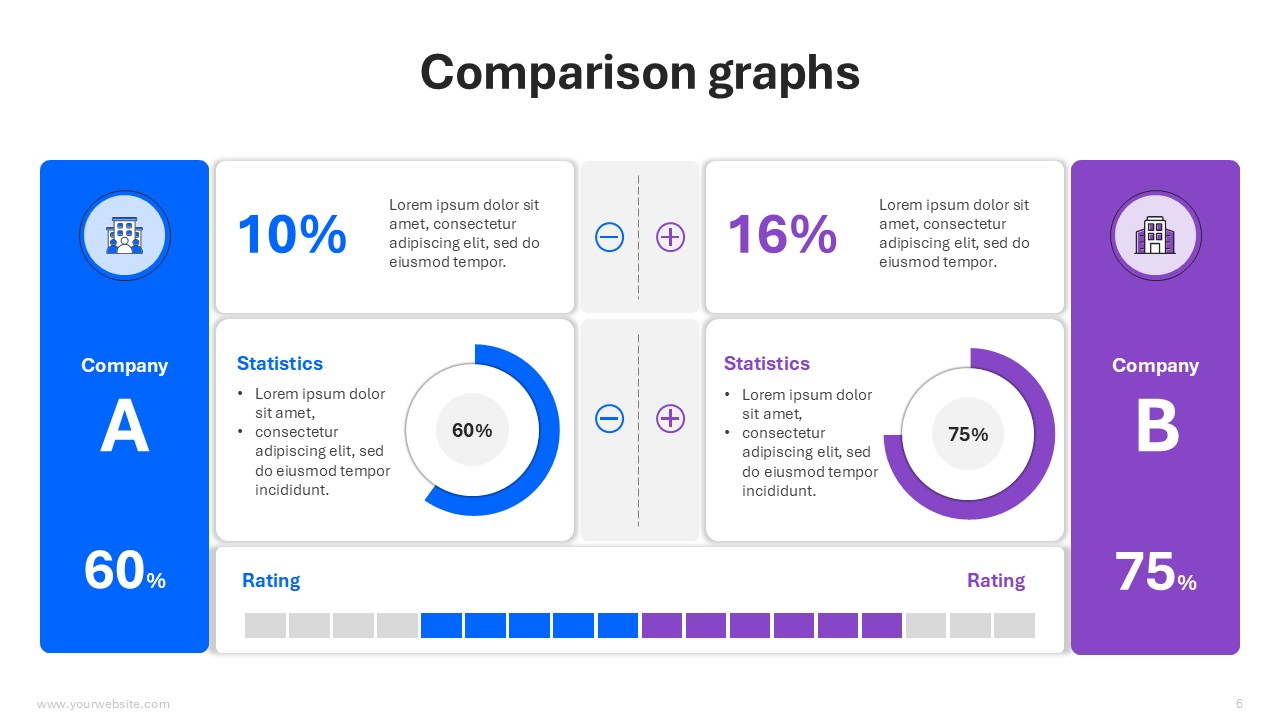
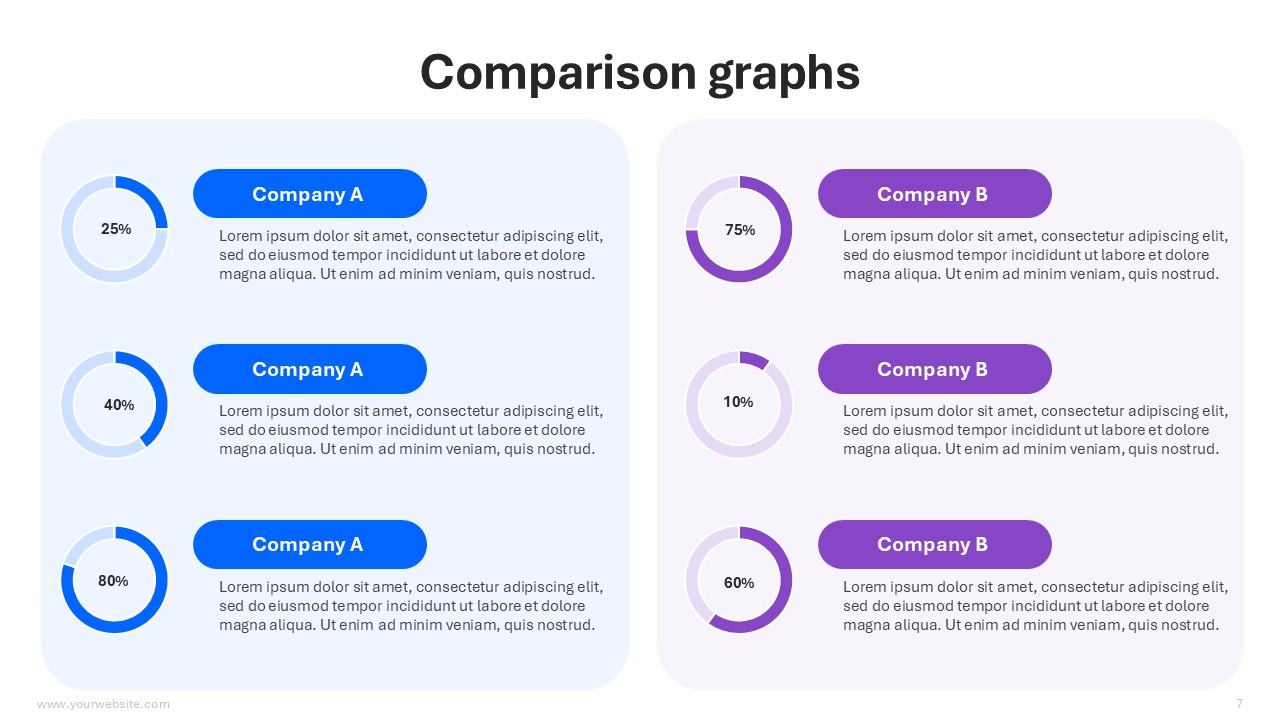
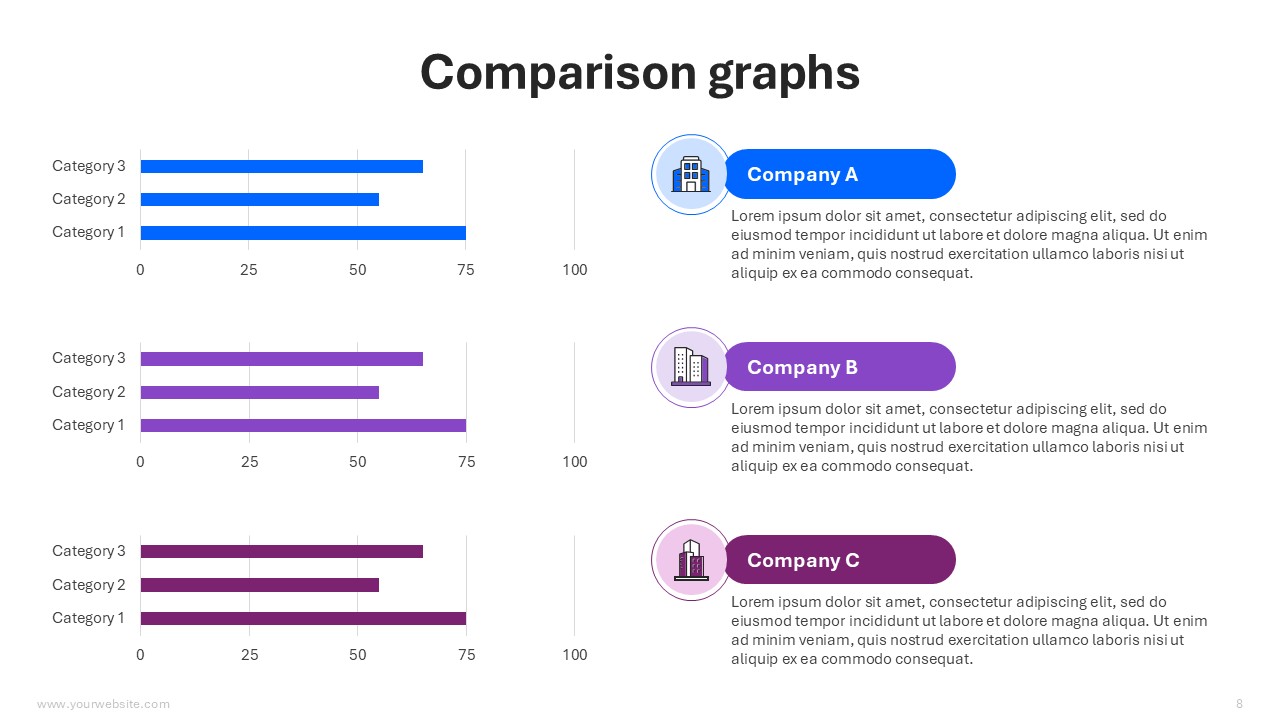
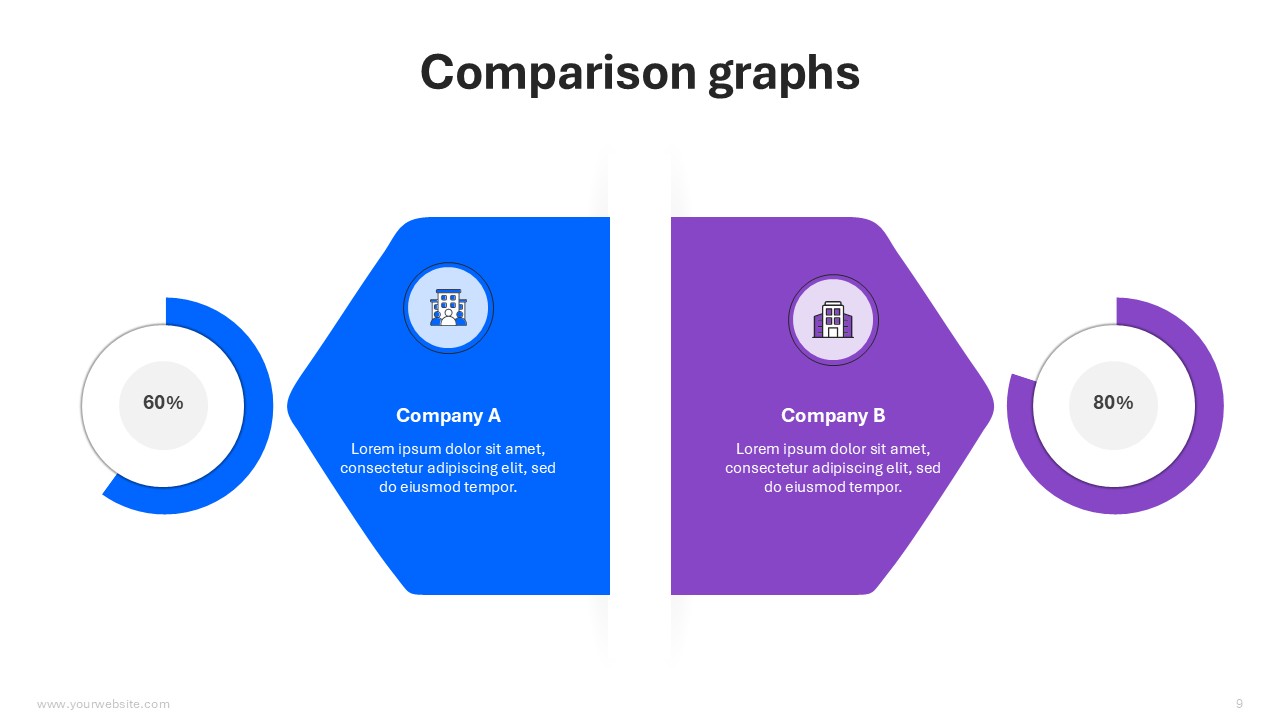
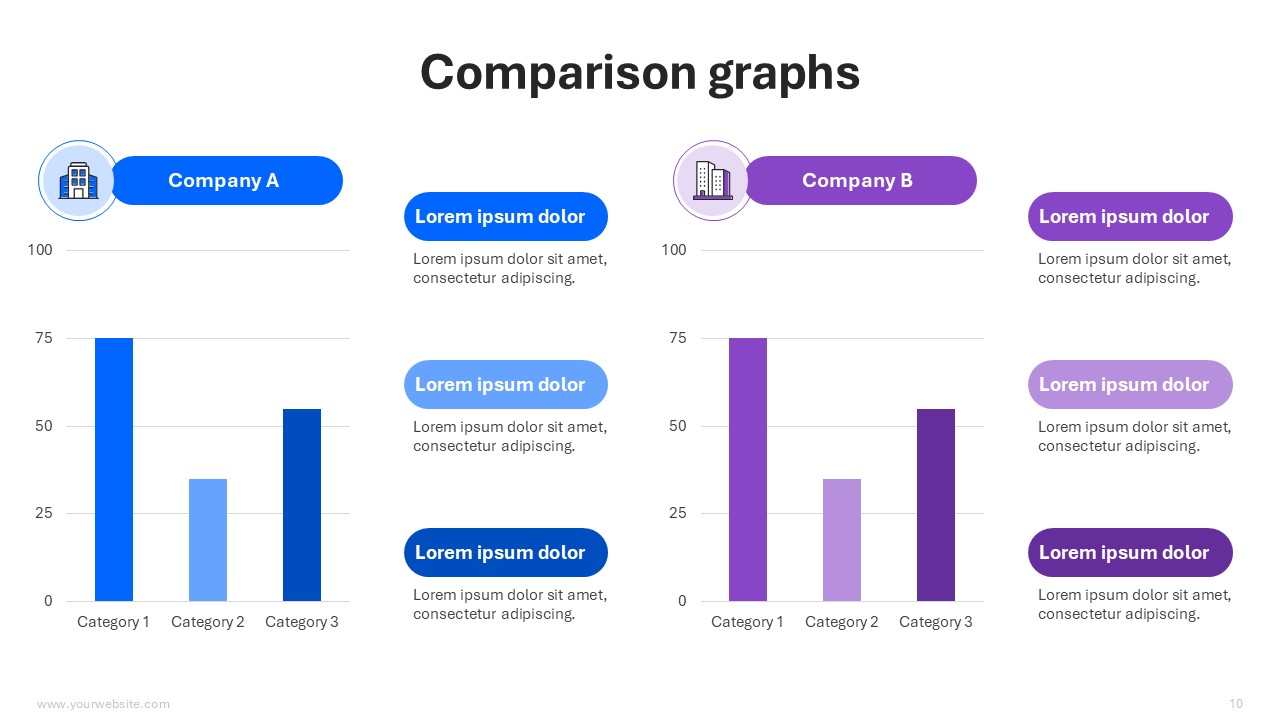
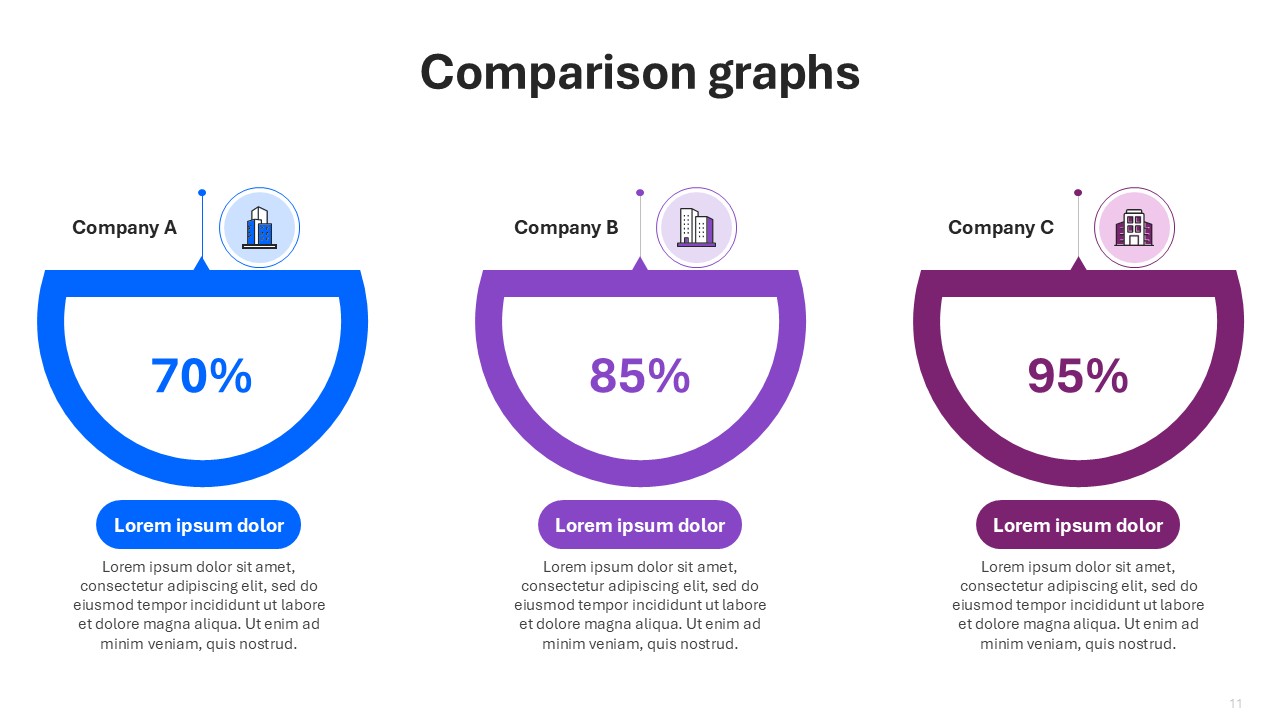
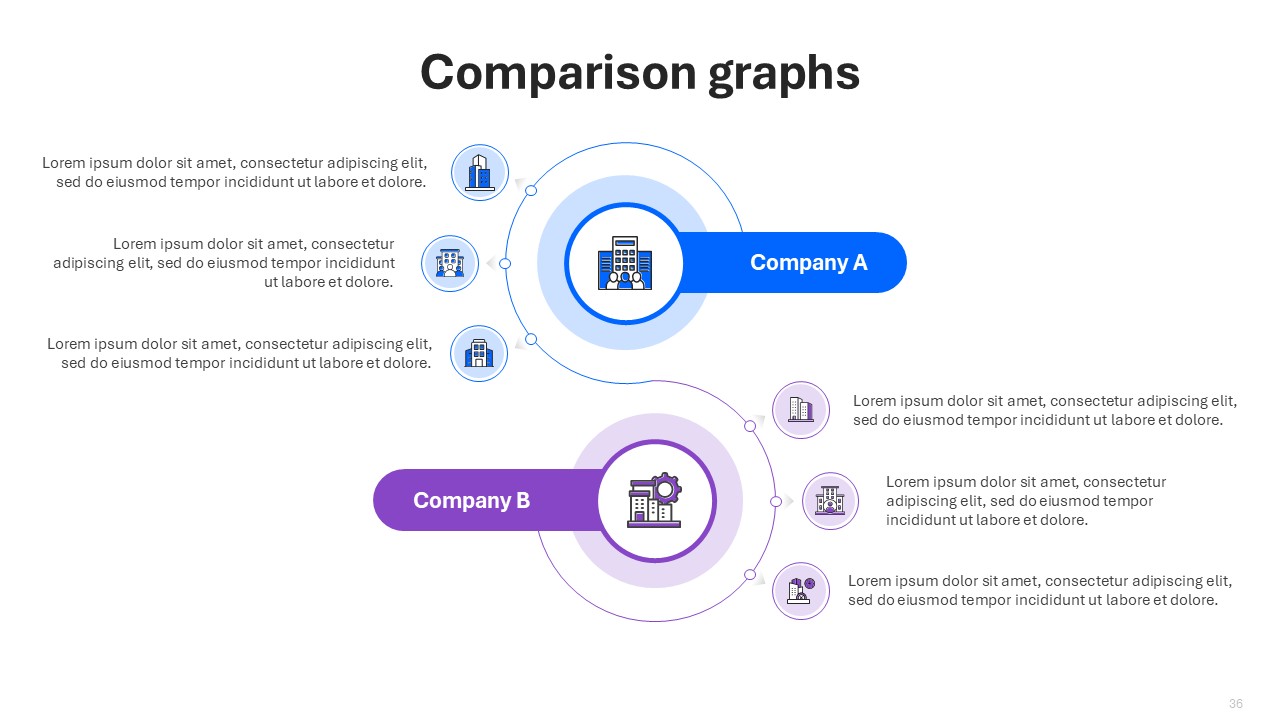
Slides range from animated column and donut charts to linear timeline maps and split-panel views, covering virtually every way comparisons are made. Specific layouts already labeled for market-share drills, year-on-year growth, cost-versus-benefit summaries, and scorecard benchmarks save presenters the time of starting from scratch. A deliberate white-space-heavy design keeps backgrounds quiet and lets data take center stage, while smart grids ensure that colors, fonts, and icons harmonize automatically. Because each element is modular, you can swap in corporate hues or alter fonts easily, yet still deliver a polished outcome that carries confidence.
Building a polished, numbers-heavy slide deck from the ground up can consume days, yet the Comparison Graph Infographics PowerPoint Template cuts that time significantly. Every slide comes pre-formatted and fully editable in both PowerPoint and Google Slides, letting users concentrate on sharpening the message instead of wrestling with alignment and color schemes. After swapping in the figures and fine-tuning any hues, presenters can step into the room confident that their visuals look as though they spent hours in expert hands.
Because the template accommodates side-by-side comparisons, trend lines, and clustered bar displays, it suits nearly any discipline- finance, marketing, education, health care, or public policy included. Users can rotate between quarterly reviews, competitive benchmarks, laboratory results, or program efficacy studies with little adjustment. In each case, the consistent style lifts the argument’s credibility and helps audiences convert numbers into actionable conclusions.
Why spend hours crafting individual slides when polished results can be ready in minutes? The Comparison Graph Infographics PowerPoint Template, available at no cost, streamlines your data storytelling with visual clarity. Download it now and elevate every comparison, ensuring each statistic, trend, and insight leaves a lasting impression.
Template Specifications
Name: | Comparison Graph Infographics PowerPoint Template |
Quantity: | 37 slides |
Ratio: | 16:9 |
Colors : | |
Rating: | Premium |
Tutorials: | Click Here to View More |
SlidesBrain offers presentation features that allow you to customize every aspect of your slides. This means you can modify text, images, colors, fonts, and icons to your liking. Additionally, adjusting graphs in PowerPoint is simple, enabling you to change colors, numbers, and labels to match your preferences and create the perfect presentation.
Looking for a slide or PPT that’s uniquely yours? Our presentation design agency is here to help make your ideas a reality. As a leading presentation design company, we focus on delivering premium-grade bespoke presentations that engage your audience and ensure message retention. Kindly get in touch with us for professional custom presentation design services and transform your brand’s message for the purpose that you have in mind.
Premium Template
Unlock this template and gain unlimited access
Template Specifications
Dimensions
15 Slides, 1366 x 768 pixels – 16:9 Aspect Ratio (HD Presentation Quality)
Format
Download as a PPT to share with your recipient or generate a shareable link for online sharing.
Customizable
This template can be fully customized. You can edit content, change image(s), apply custom colors, input your own fonts and logo, and more.
Related tags
Related Presentations
No related products found.
-
blue
Environmental scanning Infographics PowerPoint Template
Rated 0 out of 5business | 14 slides 16:9 -
blue
Cryptocurrency and Blockchain Innovations Steps 3 to 10 PowerPoint Infographics
Rated 0 out of 5Infographics | 7 slides 16:9 -
blue
Blockchain and Cryptocurrency Steps 4 to 8 PowerPoint Infographics
Rated 0 out of 5Infographics | 7 slides 16:9 -
blue
Big Data Analytics Steps 4 to 8 PowerPoint Infographics
Rated 0 out of 5Infographics | 7 slides 16:9
Related products
-
brown
Strategic Competitive Analysis Business Plan Presentation Template
Rated 0 out of 5Business | 18 slides 16:9 -
Business
One Pager Company Strategic Mission and Vision PowerPoint Template
Rated 0 out of 5Business | 1 slides 16:9 -
black
History of Saint Patrick Presentation and Google Slides
Rated 0 out of 5education | 20 slides 16:9 -
A4 Presentation Templates
Black and White Business Letterhead Design Template
Rated 0 out of 5A4 Presentation Templates | 1 slides 16:9
Customer Reviews
“A review from a customer who benefited from your product. Reviews can be a highly effective way of establishing credibility and increasing your company's reputation.”
Customer Name
“A review from a customer who benefited from your product. Reviews can be a highly effective way of establishing credibility and increasing your company's reputation.”
Customer Name