
How to Make a Concept Map in PowerPoint
Every great idea starts as a tangle of thoughts. You know the subject inside out, but stringing it into something an audience can actually follow is a different challenge altogether. That is exactly where concept maps prove their worth. Concept maps are visual diagrams that show how ideas relate to one another, with a central topic at the heart and connected nodes branching outward to capture sub-concepts, supporting details, and the links between them.
PowerPoint, the tool most professionals already have open on their laptops, is more capable than people give it credit for. Its native Shapes library, SmartArt graphics, connector tools, and formatting controls give you everything you need to build a concept map that looks polished and communicates clearly. No specialist diagramming software required. Whether you are mapping out a project workflow, structuring a lesson plan, walking stakeholders through a business strategy, or simply trying to make sense of a complex topic before your next meeting, PowerPoint can handle it with the right approach.
This guide will walk you through the entire process, from setting up your slide to adding the finishing design touches, with practical tips at every stage.
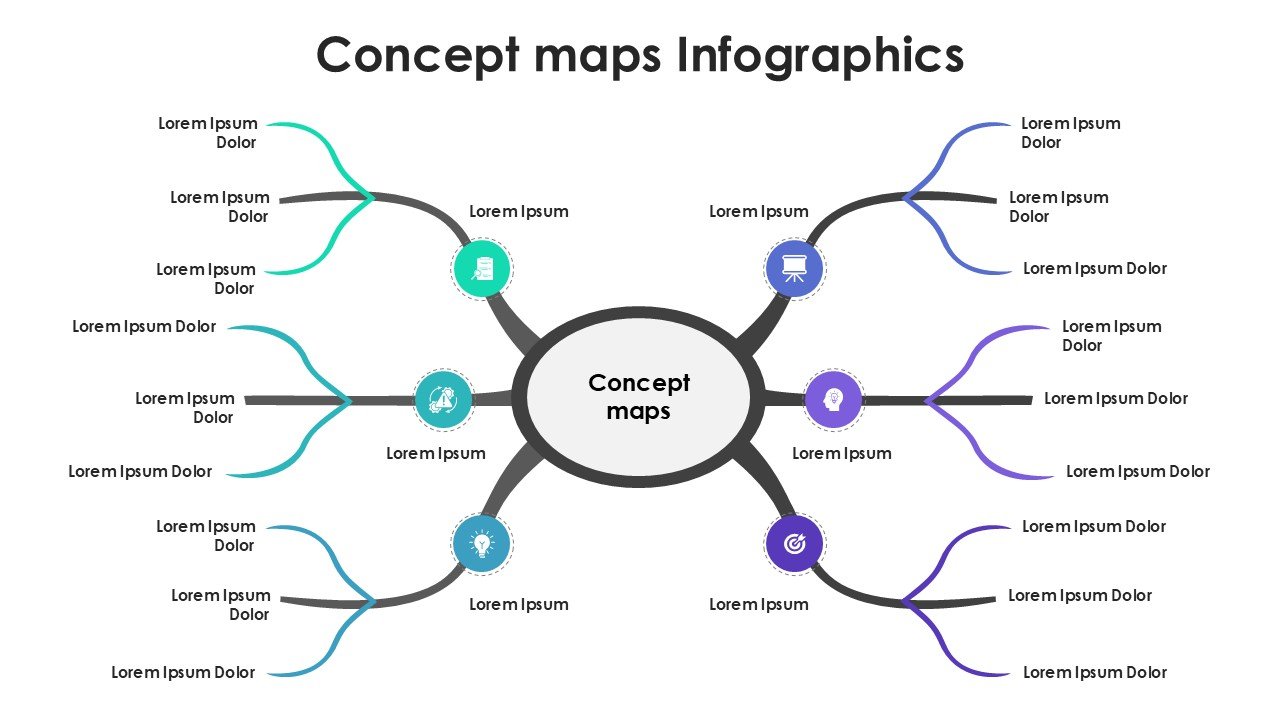
Please check out ready to use template – Concept maps Infographics for PowerPoint and Google Slides to create professional presentations faster.
What Is a Concept Map and Why Does It Matter?
A concept map is a visual representation of knowledge. It consists of nodes connected by labelled lines or arrows that describe the relationship between them. The structure is typically hierarchical, with the most general concept at the top or centre and more specific ideas branching outward from it.
In a professional context, concept maps serve a wide range of practical purposes:
- Brainstorming and early-stage planning, where you need to get ideas out of your head and into a structured form
- Explaining complex systems or processes to a non-specialist audience
- Mapping project dependencies or team responsibilities
- Summarizing research findings or strategic frameworks
- Onboarding new employees to understand how different parts of a business are connected.
Why Use PowerPoint for Concept Maps?
There is no shortage of dedicated diagramming tools on the market. Miro, Lucidchart, Creately, Canva, and others all offer concept mapping features. But PowerPoint has a distinct advantage for most working professionals: it is already part of your workflow. You are not switching between platforms, learning a new interface, or worrying about file compatibility. You build the concept map and the presentation in the same place.
PowerPoint also gives you fine-grained control over design. You can apply your concept map exactly to your brand’s colour palette and typography, use custom shapes, layer design elements, and add icons or images without having to work against a rigid template.
The main limitation is that PowerPoint is not purpose-built for diagramming, so working with large, intricate maps can become tedious. Aligning objects manually, adjusting connectors when you reposition a node, and managing the overall layout across many elements requires patience. For complex projects, starting with a well-designed concept map template from SlidesBrain can save considerable time while still keeping you in the PowerPoint environment you know.
How to Make a Concept Map in PowerPoint: Step-by-Step
Step 1: Set Up a Clean Slide
Open a new presentation in PowerPoint and choose a blank slide layout. Go to the Home tab, click Layout, and select Blank. A cluttered slide with default title and content placeholders will only get in the way when you are building a diagram.
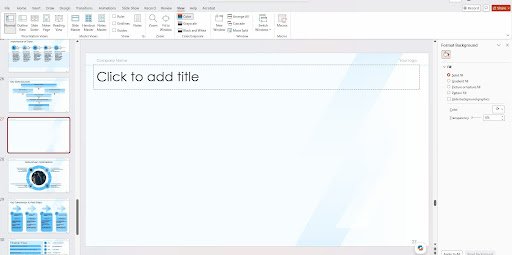
While you are setting up, enable gridlines and guides to help you place and align elements precisely. Go to the View tab and check Gridlines. You can also go to View > Guides to add adjustable guide lines as reference points. These will not appear in your final presentation but make positioning much easier during the build.
If you are building multiple concept maps across a deck, consider setting a consistent slide background at this point. A light grey or off-white background reduces glare and makes colored shapes pop more effectively than pure white.
Step 2: Add Your Central Concept
The central idea is the anchor of your entire concept map. Everything else connects back to it, so it should be visually dominant and placed at the center of the slide.
Go to Insert > Shapes and select an Oval or Rounded Rectangle. Click and drag on the slide to draw the shape, holding Shift as you drag to keep it perfectly circular or square. Size it generously, around a quarter of the slide width, so it stands out clearly.
Double-click the shape to add text and type your central concept or topic. Format the text to be bold, readable at a glance, and sized larger than the text in your sub-concept nodes. Use the Shape Format tab to give the central shape a distinct fill color that you will use consistently throughout to mark the top level of your hierarchy.
Step 3 Add Sub-Concept Nodes
Once your central concept is in place, identify the main ideas that branch directly from it. These are your primary sub-concepts. For most concept maps, three to six primary sub-concepts work well. Too few and the map feels thin; too many and it becomes cluttered and hard to read.
Insert a new shape for each sub-concept, this time slightly smaller than your central shape. Position them around the central concept, distr
ibuting them evenly so the map feels balanced. PowerPoint’s Smart Guides (the faint lines that appear as you drag) help you align and space elements consistently without having to measure manually.
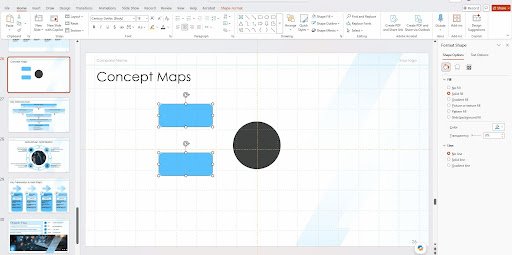
A practical approach is to copy and paste your first sub-concept shape rather than drawing each one from scratch. This guarantees they are all exactly the same size and style. Select the shape, press Ctrl+C and then Ctrl+V, then drag the copy to its new position. Repeat for each sub-concept.
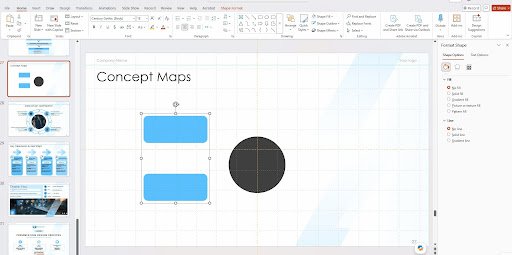
Label each node clearly and concisely. A node label should be a term or short phrase, not a full sentence. If you need to add explanatory detail that belongs in your speaker notes or in supporting body text on the slide not crammed into the node itself.
Step 4: Connect Nodes with Lines or Arrows
Connecting lines are what turn a collection of shapes into an actual concept map. They show the relationships between ideas and give the diagram its meaning.
Go to Insert > Shapes and scroll down to the Lines section. Choose either a straight line with an arrow, a curved connector, or an elbow connector depending on the style you prefer. Elbow connectors are tidy for structured, hierarchical maps; curved connectors work better for more organic layouts.
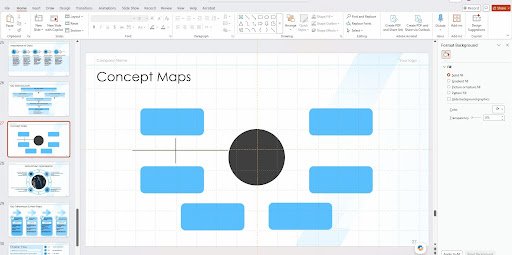
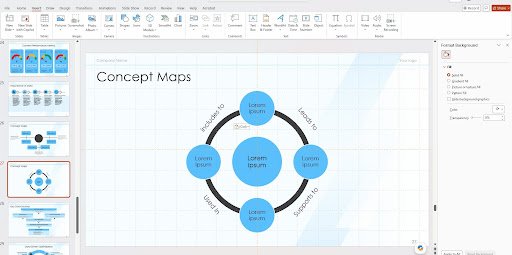
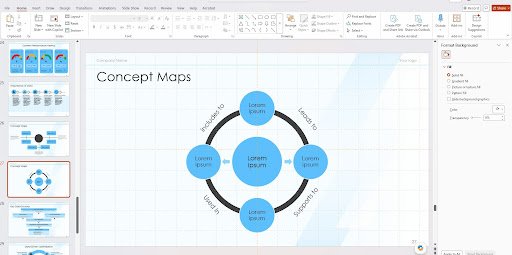
Hover over the edge of your central concept shape until you see the green connection points appear. Click and drag from one of these points to the corresponding point on your sub-concept shape. PowerPoint will snap the connector to both shapes, so if you later move a node, the connector updates automatically. This is one of the most important details to get right early: always connect lines to the shapes themselves, not just draw lines near them.
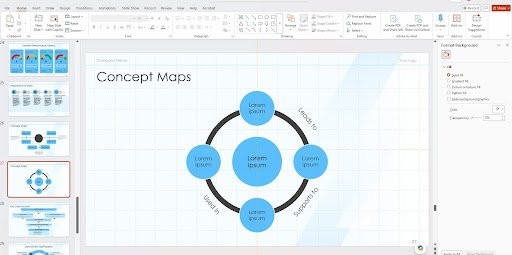
After drawing your connectors, add relationship labels. Double-click a connector line to add text directly to it. Short linking phrases like leads to, is defined by, depends on, or supports do more to clarify meaning than unlabeled lines. This is what distinguishes a concept map from a simple diagram.
Step 5: Add Supporting Detail Nodes
If your concept map requires a third level of detail, add supporting nodes that branch from your primary sub-concepts. These should be visually the smallest and lightest of the three shape tiers, using a neutral color or a lighter shade of your sub-concept color.
Be selective. A concept map with too many levels and too much detail becomes harder to read than the topic it is meant to explain. As a general rule, if any branch has more than three supporting nodes, consider whether some of that information could be covered in a separate slide or in your spoken commentary rather than on the map itself.
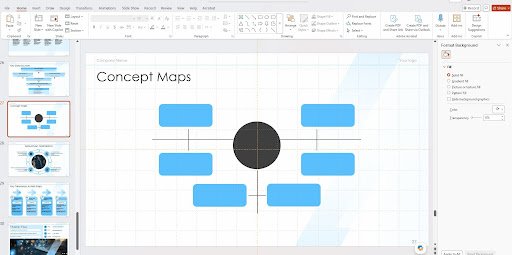
Connect these detail nodes to their respective sub-concepts using thinner, lighter connectors than those you used for the primary level. The visual weight of the lines should reinforce the hierarchy.
Step 6: Use SmartArt as an Alternative Starting Point
SmartArt graphics are pre-built diagram structures that you populate with your own text, and several of the available layouts work well as concept map starting points.
Go to Insert > SmartArt. In the dialog box, look under the Hierarchy Infographics or Relationship categories. The Radial Cycle and Relationship layouts in particular are well-suited to concept mapping. Select one, click OK, and PowerPoint inserts a pre-structured diagram directly onto your slide.
From there, click on each text placeholder to add your content. You can add or remove branches using the text pane on the left. To style the diagram, use the SmartArt Design and Format tabs in the ribbon, which give you color options, shape styles, and layout tweaks.
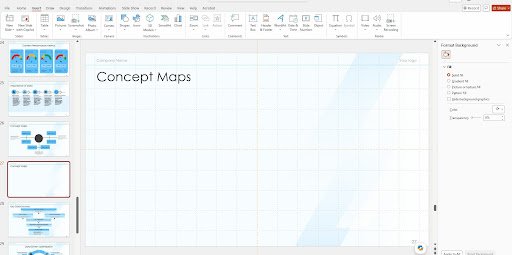
The trade-off with SmartArt is customization. The built-in layouts are constrained, so if you have an unusual structure or want a highly specific visual style, you will quickly hit the limits of what SmartArt allows. For full control, the manual approach in the previous steps is the better route.
Step 7: Apply Consistent Formatting and Polish
A concept map that communicates well is one where the visual design reinforces the structure, not one that just has attractive colors. This final step is about reviewing your map through the eyes of someone seeing it for the first time.
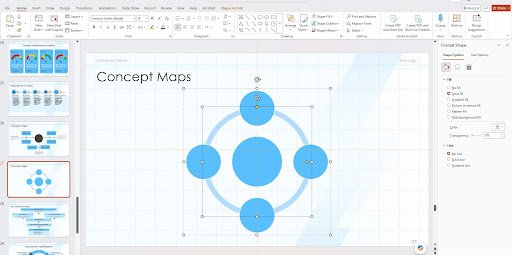
Check alignment by selecting all your shapes and using the Arrange > Align tools to ensure everything sits on the same horizontal or vertical axis where appropriate. Use ‘Distribute Horizontally’ or ‘Distribute Vertically’ to space elements evenly.
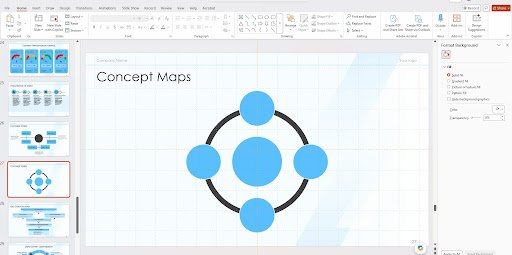
Review your font sizes. Text in the central node should be the largest, followed by the primary sub-concepts, with supporting nodes smallest. If any label text is overflowing its shape or appears too small to read comfortably, resize the shape or reduce the text.
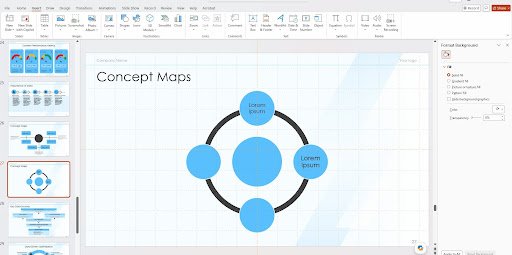
Finally, check your color contrast. Light text on a light shape, or dark text on a dark shape, will be illegible. Use the Format Shape panel to adjust fill and text colors until you have a clear contrast ratio throughout the map.
Step 8: Save and Present
When you are satisfied with the design, save your file as a standard .pptx for continued editing. If you need a version that preserves the design without editability, File > Export > Create PDF/XPS gives you a clean PDF export.
During your actual presentation, use the Slide Show tab to run the deck. Your concept map will render in full resolution, and you can use a laser pointer or the built-in annotation tools (available in presentation mode by right-clicking) to highlight specific nodes and connections as you walk your audience through the map.
How SlidesBrain Compares to Other Template Sources?
You have choices when it comes to downloading ready-made org charts templates. SlidesBrain approaches the problem differently. The library is built around clean, professionally designed slide decks with a clear visual standard across every template. The concept map and mind map templates are designed for business use first, meaning they work equally well in a boardroom presentation, a client workshop, or a strategic planning session. The color systems are neutral enough to adapt to almost any brand palette with minimal editing, and the structural layouts are based on genuine information design principles rather than purely aesthetic choices.
The practical advantage: you spend your time on the content, not on redesigning someone else’s template to make it usable.
Frequently Asked Questions
What Is a Concept Map in PowerPoint?
A concept map demonstrates the hierarchy of a concept. The main idea is situated in the middle of the map, and branches off the main idea are sub concepts and supporting details. These ideas are shown through the use of shapes (called nodes) and lines (or arrows) that indicate the relationship (called connectors) between the ideas.
How Do I Create a Concept Map in PowerPoint?
To create a concept map in PowerPoint, follow these steps:
- Make a Blank Slide : Go to Home > New Slide > Blank. Next, to enable the layout grids, click on the View tab and check the Gridlines tab.
- Add the Main Idea: Go to Insert > Shapes, select the Oval shape, or the Rounded Rectangle shape, and place it in the center.
- Add the Sub Ideas: Insert smaller shapes. To keep them the same size, use the Ctrl+C and Ctrl+V commands.
- Connect the shapes: To draw a line, go to Insert > Shapes > Lines. Then go to a green connection point on the main idea shape and draw it to an anchor point on the sub idea shape.
- Add the Labels: Add a short description of the relationship on the line, by double-clicking the line.
How Do I Create a Concept Map in PowerPoint?
Yes, creating a concept map in PowerPoint is simpler with predesigned frameworks that are ready to use by going to Insert > SmartArt .
The best layouts to use are those found in the Hierarchy or Relationship categories.
To add or remove nodes, use the Text Pane found on the left side of the SmartArt box.
In the SmartArt Design tab, you can customize your diagram by adding color or design ideas.
How Do I Make Sure Lines Stay Connected to Shapes When I Move Them?
In order for lines to stay connected to shapes, you need to use Snap-On Connectors:
- Select a line by going to Insert > Shapes > Lines.
- Move your cursor to the edge of your shape until you see the green connection points.
- Click and drag your line to the green connection points.
This method will ensure that the symmetry of your layout is kept.
How Do Concept Maps and Mind Maps Differ From Each Other?
Concept Map: There is a clear structure to a concept map. Parent-child relationships are shown and cross-linked. For complex relationships, labeled connections are required.
Mind Map: There is no structure to a mind map. There are no cross-links. Keywords are organized in branches which are colored and include drawings.
Where Are the High Quality Concept Map Templates for PowerPoint?
Creating concept maps by hand can be time consuming, and a low quality design can come from this. Professionally designed concept maps can be downloaded from SlidesBrain to save time and design. A great example of these can be found in the SlidesBrain Business Diagram & Framework Layouts.
What is a concept map in PowerPoint examples?
A classic example of a PowerPoint concept map is a spider map or a multi-level flow diagram.
A real world example, like the template above, would break down the topic of business as follows.
- Central Node: Digital Marketing Strategy
- Sub-Nodes: SEO, Content Marketing, Paid Ads
- Connecting Lines: Arrows labeled with phrases like “drive organic traffic to”. This would link the SEO node to the sub-topic of Blog Content.
Can ChatGPT make concept maps?
While native .pptx concepts can’t be drawn or linked in a post by ChatGPT since it can’t output an image directly from text, the framework for one can be created.
If an AI tool like ChatGPT or Gemini is asked for a concept map, it would provide the following:
- A text outline or hierarchy that can be copied into the SmartArt text pane of PowerPoint directly.
- Mermaid.js syntax or Graphviz DOT code, which you can paste into free online visualizers for fast, high-quality diagrams.